

There is no single American price for a 2-bedroom apartment, and any website that gives you one number is hiding the real story. On HUD’s official FY2026 benchmarks, a 2-bedroom home runs from $937 a month in Major County, Oklahoma, to $3,604 a month in the San Francisco metro area — for the same benchmark, in the same year.
That spread is not an error. It is the honest answer to the question, and this guide unpacks it properly: what the official Fair Market Rent figures are, how they are built, where they sit in real metro areas, and how they differ from both the rent on a listing and the Section 8 payment standard.
Every figure below comes from the U.S. Department of Housing and Urban Development (HUD), read from HUD’s Fair Market Rent Documentation System for FY2026 — the latest schedule HUD has published there. Where a number is an example rather than a benchmark, the text says so.
The Short Answer: It Depends on the Map, Not the Country
A 2 bedroom apartment costs what its local market says it costs. Rent is one of the most local prices in the economy, because a home cannot be moved from a cheap market to an expensive one.
Three forces explain almost all of the gap between areas. First, local wages and demand set what tenants can pay and what landlords can charge. Second, housing supply decides whether landlords compete for tenants or tenants compete for homes. Third, land and construction costs in dense coastal metros push every rent upward before a landlord earns a cent.
So the useful question is never “what does a 2-bedroom cost in America?” It is “what does a 2-bedroom cost in this county, this metro, or even this ZIP code?” HUD’s benchmark system is built exactly that way, area by area, which is why this guide works from it.
What Counts as Rent: The Gross Rent Definition
Before comparing numbers, you need to know what the numbers include. HUD’s Fair Market Rents are gross rents: the monthly shelter rent plus the cost of utilities the tenant pays for, except telephone.
That definition matters more than it looks. A listing at $1,400 with utilities included can be cheaper in real terms than a listing at $1,300 where the tenant also pays for heat, water, and electricity. Gross rent puts both homes on the same footing.
It also means an FMR is not directly the figure on a lease. A lease states contract rent for that unit. The FMR is an area-wide gross-rent estimate, built to a statistical standard explained in the next section. Keep the two ideas separate and every figure in this guide will make sense.
HUD Fair Market Rents: The Official Benchmark Explained
A Fair Market Rent (FMR) is HUD’s estimate of the gross rent for a standard-quality home in a defined local area. HUD publishes FMRs for every metropolitan area and every non-metropolitan county in the country, for each bedroom size, and updates them every fiscal year.
The benchmark is set at roughly the 40th percentile of rents in the area. In plain terms, about 40 percent of standard-quality homes in the area rent for less than the FMR, and about 60 percent rent for more. It is deliberately a middle-of-the-market figure, not a luxury figure and not a bargain-basement one.
For FY2026, HUD built the figures mainly from the American Community Survey’s 2019–2023 five-year estimates of 2-bedroom standard-quality gross rents. It then applied a recent-mover adjustment, an inflation adjustment, and a trend factor to bring the numbers forward to FY2026. Two safety rails also apply: no area’s FMR falls below its state minimum, and no FMR drops below 90 percent of the previous year’s figure.
One metro used fresher local data instead. New York’s FY2026 figures rest on a local rent survey conducted in December 2024, which HUD judged more current than the survey estimates. Either way, the purpose is identical: a defensible, published benchmark for what a modest home costs to rent in that area.
HUD does not publish these numbers for trivia. FMRs anchor the Housing Choice Voucher programme (Section 8), and they give landlords, renters, and lenders a common reference point. The next sections show what the benchmark actually looks like on the ground.
FY2026 2-Bedroom Fair Market Rents in Major Metro Areas
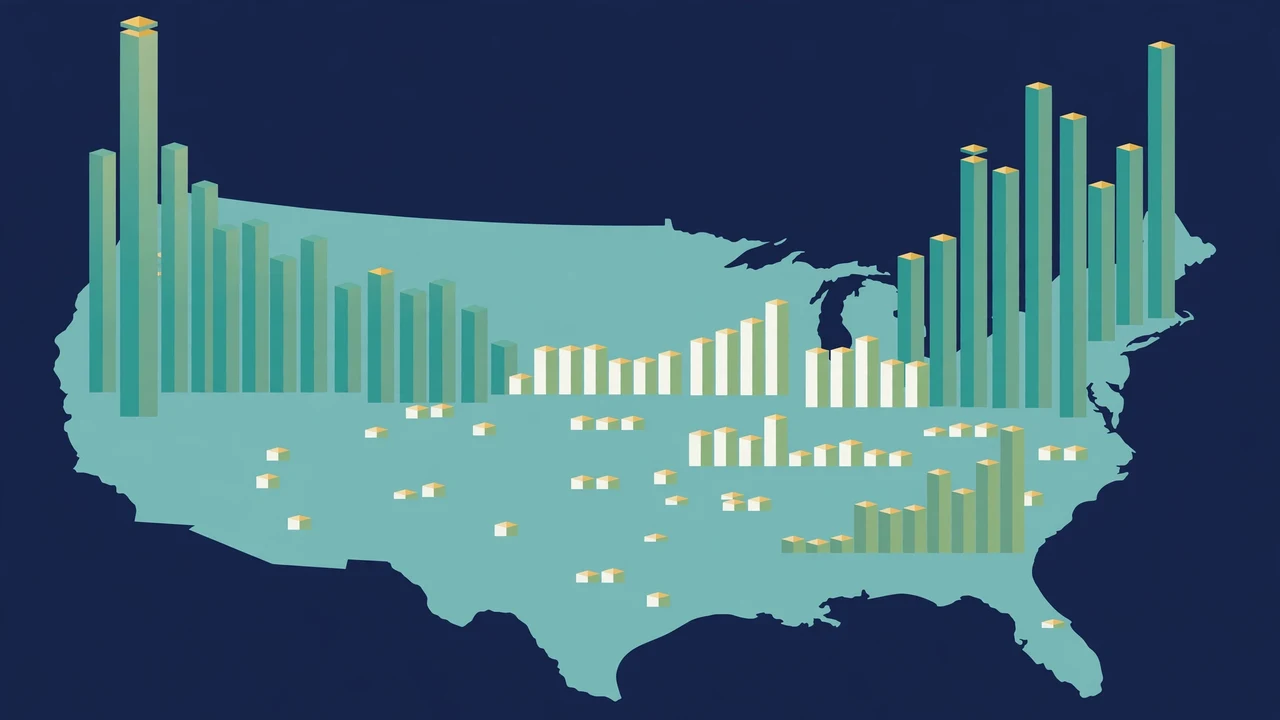
Here are the FY2026 Fair Market Rents for three large metro areas that use a single metro-wide figure:
| Metro area | 1-bedroom | 2-bedroom | 3-bedroom |
|---|---|---|---|
| San Francisco, CA metro area | $2,977 | $3,604 | $4,604 |
| New York, NY metro area | $2,655 | $2,910 | $3,644 |
| Houston-The Woodlands-Sugar Land, TX metro area | $1,323 | $1,573 | $2,116 |
Read the 2-bedroom column slowly. San Francisco’s benchmark is more than double Houston’s. A landlord with a $1,573 unit in Houston and a landlord with a $3,604 unit in San Francisco own the same product on paper — a standard-quality 2-bedroom home — in completely different economies.
The year-to-year movement is also worth seeing. San Francisco’s 2-bedroom FMR rose from $3,318 in FY2025 to $3,604 in FY2026. New York’s rose from $2,780 to $2,910, and Houston’s from $1,529 to $1,573. Benchmarks in expensive metros are not just higher; recently, they have also been climbing faster in dollar terms.
One caution before you use these figures: several of America’s largest metros do not have a single metro-wide FMR for voucher purposes at all. They use the ZIP-code system explained next, so any article quoting one “Los Angeles FMR” or one “Phoenix FMR” without that context is oversimplifying.
When One City Has Many Prices: Small Area Fair Market Rents
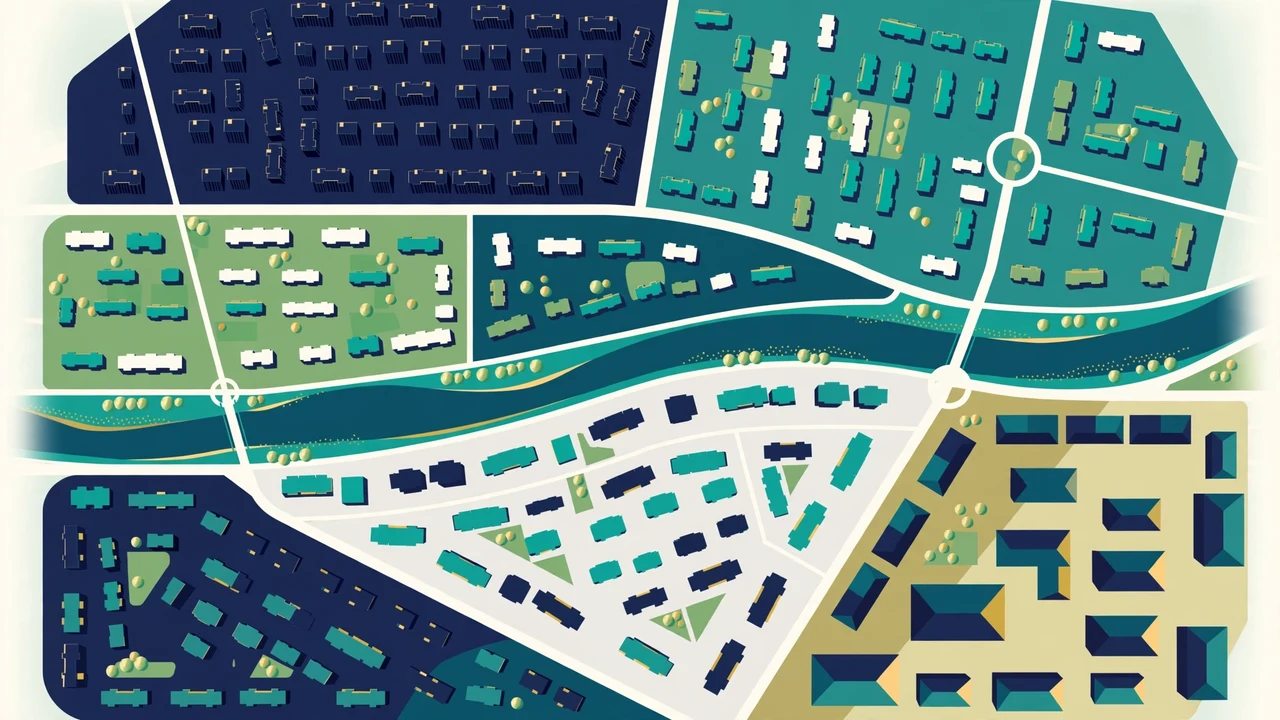
In many large metros, HUD’s voucher programme uses Small Area Fair Market Rents — FMRs set for each ZIP code instead of one figure for the whole metro. The reason is simple: a single metro figure is too blunt when rents double from one side of a city to the other.
Los Angeles shows the spread clearly. In the FY2026 tables for the Los Angeles-Long Beach-Glendale metro area, the 2-bedroom Small Area FMR is $2,070 in ZIP code 90058 and $2,220 in ZIP code 90001 — but $4,350 in ZIP code 90210, Beverly Hills. Same county, same year, more than double the benchmark.
Phoenix tells the same story at lower altitude. The 2-bedroom Small Area FMR is $1,840 in ZIP code 85001, in the downtown core, $2,250 in ZIP code 85044, and $2,760 in ZIP code 85249. A renter asking “what does a 2-bedroom cost in Phoenix?” gets three different correct answers inside one metro.
Houston adds a twist: it has a metro-wide FMR of $1,573, yet ZIP-level Small Area figures are also published because the housing agencies representing most of its vouchers opted into the ZIP system. ZIP code 77002, for example, carries a 2-bedroom Small Area FMR of $2,360 — far above the metro figure. Chicago’s voucher programme likewise runs on ZIP-code figures.
The lesson for any reader: in a Small Area metro, “how much is a 2 bedroom apartment” is a ZIP-code question. Quote the ZIP, or do not quote a number at all.
The Other End of the Scale: Small-Town and Rural Counties
Now look at the bottom of the range, because it explains why national averages mislead. In Major County, Oklahoma — a non-metropolitan county — the FY2026 2-bedroom FMR is $937 a month. That is roughly a quarter of San Francisco’s benchmark.
Major County also reveals how the safety rails work. HUD’s calculation produced a preliminary figure of $803 for the county, but FY2026 FMRs cannot fall below the state minimum, so the published figure is Oklahoma’s state minimum of $937. The benchmark you see is the floor, not the raw calculation.
Vance County, North Carolina, another non-metropolitan county, has a FY2026 2-bedroom FMR of $975. Its calculated figure stood on its own, above North Carolina’s $925 state minimum. And Vance County shows the other direction of travel: its benchmark fell from $1,022 in FY2025 to $975 in FY2026. Benchmarks do not only rise.
Thousands of counties sit in this lower band. Any “average US rent” blends these counties with San Francisco and New York and produces a number that describes almost nowhere. That is why this guide refuses to give you one.
Fair Market Rent Is Not Market Rent
The most common mistake with these figures is treating the FMR as the rent. It is not, and the difference matters to landlords and renters alike.
Market rent is a live price: what a specific home, in a specific building, actually leases for today. It moves with listings, vacancies, seasons, and negotiation. An FMR is a statistical benchmark built from survey data collected over earlier years and adjusted forward by formula. By construction, it describes the middle of an area’s market, not any individual home in it.
Three practical consequences follow. First, a new or renovated apartment in a good building will usually lease above the FMR, and that alone does not make it overpriced. Second, an older unit in weaker condition may lease below the FMR without being a bargain. Third, the FMR can lag a fast-moving market in either direction, because its base data is always older than today’s listings.
Used properly, the FMR is a reference line. It tells you where the middle of the local market sat by HUD’s measure. What a specific 2-bedroom should rent for still depends on the home itself — the subject of a later section.
Fair Market Rent vs Section 8 Payment Standards
The second confusion to clear up: the FMR is not the amount a housing agency will pay, either. That figure is the payment standard, and it is set locally.
Under the federal regulation (24 CFR 982.503), the local public housing agency sets a payment standard for each unit size. Without HUD approval, it may set that standard anywhere in a basic range from 90 percent to 110 percent of the published FMR. Going outside that range requires HUD’s approval as an exception payment standard.
Run the arithmetic on San Francisco’s FY2026 2-bedroom FMR of $3,604. Ninety percent is about $3,240, and 110 percent is about $3,960. So two neighbouring agencies using the same FMR could legitimately run payment standards roughly $700 apart. The FMR is the anchor; the payment standard is the local decision.
Even the payment standard is not the rent. It caps the subsidy calculation. The actual rent on a voucher tenancy must also pass the agency’s rent-reasonableness check, which compares the unit with similar unassisted homes nearby, and the family’s own contribution is calculated from its income under the programme’s rules. FMR, payment standard, and contract rent are three different numbers — keep them separate and the system makes sense.
What Actually Sets the Rent on a Real 2-Bedroom
Benchmarks describe areas. Individual rents are set by the home and its micro-location. These are the factors that move a real 2-bedroom above or below its area’s middle:
- Position within the metro. The Small Area figures prove it: neighbourhood can matter more than city.
- Condition and age. Renovated kitchens, in-unit laundry, and modern systems command premiums; dated units discount.
- What is included. Utilities, parking, and furnishings inside the rent change the real cost, which is why HUD compares gross rents.
- Building type and amenities. A unit in a full-service building prices differently from the same floor plan in a small walk-up.
- Local supply pressure. Where new apartments are scarce and demand is strong, even ordinary units lease quickly at strong rents.
- Timing. Leasing seasons and local employment cycles move asking rents within a single year, while the FMR updates once a year.
For landlords, this list is the pricing checklist: place your unit honestly on each factor, then compare it with the benchmark. For renters, it is the negotiation checklist: a rent above the FMR needs visible reasons from this list.
How Bedroom Counts Change the Price
Bedrooms step the price up, but not evenly. The FY2026 figures for the areas already covered make the pattern concrete:
| Area | 1-bedroom | 2-bedroom | 3-bedroom |
|---|---|---|---|
| Houston, TX metro area | $1,323 | $1,573 | $2,116 |
| San Francisco, CA metro area | $2,977 | $3,604 | $4,604 |
| Vance County, NC | $743 | $975 | $1,197 |
In Houston, moving from one bedroom to two adds $250 a month to the benchmark, while the move from two to three adds $543. In San Francisco the steps are $627 and then a full $1,000. Larger homes are scarcer in expensive metros, and the benchmark prices that scarcity.
Vance County breaks the pattern politely: its steps are $232 and $222, almost even. In low-cost rural markets, extra space is cheaper to supply, so the price ladder is flatter. Either way, the 2-bedroom sits in the market’s centre — which is precisely why HUD builds the whole FMR system around the 2-bedroom figure and derives the other sizes from it.
How Landlords Use These Benchmarks

For a landlord, the local FMR is a free, published sanity check on pricing. If your asking rent sits far above the area benchmark, you need a visible reason — condition, inclusions, micro-location — or the market will correct you with vacancy. If it sits far below, you may be leaving money on the table, or your unit may be a genuine value play that fills fast.
The benchmark matters even more if you rent, or might rent, to a voucher holder. Your realistic ceiling in that segment is the local payment standard — 90 to 110 percent of the FMR — and the unit still has to pass rent reasonableness. Knowing both numbers before you buy a property in an unfamiliar area prevents expensive surprises.
Rent, though, is only the income line. Whether a 2-bedroom purchase actually works depends on the full numbers, which is why our guide to compare rental yields across states and the Cash Flow Calculator belong in the same analysis: test the local rent against the mortgage, taxes, insurance, and running costs before you commit.
Finally, treat the benchmark as one input to a long-term plan, not a pricing autopilot. Our overview of long term rental strategy covers how pricing discipline compounds across a hold period — small monthly gaps, repeated over years, are where rental returns are really made or lost.
How Renters Can Use the Benchmark Before Signing
Renters can use the same figures from the other side of the table. Before signing, find your area’s FMR and compare the asking rent with it. An asking rent near the benchmark is, by definition, near the middle of the local market for a standard-quality home.
An asking rent well above the FMR is a prompt to ask questions, not an automatic refusal. Newer buildings, included utilities, parking, and prime micro-locations all justify premiums — but the landlord should be able to point to them. If nothing on the list explains the gap, you have a factual basis for negotiating or walking away.
Also compare like with like. Because the FMR is a gross rent, convert the listing to the same basis before comparing: add the utilities you would pay on top of the contract rent. A $1,300 listing plus $200 of utilities is a $1,500 gross rent, and it should be judged against the benchmark as such.
How to Look Up the Fair Market Rent for Your Area
You can check any area’s figures yourself in a few minutes, free, on HUD’s own system:
- Open HUD’s Fair Market Rent Documentation System on the HUD User website — the FY2026 San Francisco documentation page is a good entry point, and every page carries a “select a different area” tool.
- Choose the fiscal year (FY2026 is the current schedule in the system), then your state and your county or metro area.
- Read the table for your bedroom size. If your metro uses Small Area FMRs, the page will show ZIP-code rows instead of one metro figure — find your ZIP.
- Note the figure’s basis before you use it: it is a gross rent, it is the final published figure for that fiscal year, and HUD shows its calculation steps on the same page.
Save the page or the figure with its year attached. “The FMR is $1,573” is an incomplete statement; “the FY2026 2-bedroom FMR for the Houston metro area is $1,573” is a fact you can rely on and recheck next year when HUD publishes the new schedule.
People Also Ask
There is no single official figure, because HUD publishes Fair Market Rents area by area, not as one national average. In FY2026 the 2-bedroom FMR runs from under $1,000 in many rural counties — $937 in Major County, Oklahoma — to $3,604 in the San Francisco metro area. Any single “average” hides more than it tells you.
A Fair Market Rent (FMR) is HUD’s estimate of the gross rent — rent plus utilities, except telephone — for a standard-quality home in a specific area. It is set at roughly the 40th percentile of rents in that area, updated every fiscal year, and used mainly to run the Housing Choice Voucher programme.
No. Market rent is what homes actually lease for today. An FMR is a statistical benchmark built from survey data and adjusted forward, so it can sit above or below the rent on a specific listing, especially for new or luxury buildings.
The local housing agency sets a payment standard for each unit size, normally between 90% and 110% of the FMR — for a $3,604 FMR, roughly $3,240 to $3,960. The payment standard caps the subsidy calculation; it is not the rent itself, and the rent must also pass a rent-reasonableness check.
In many large metros the voucher programme uses Small Area FMRs, set ZIP code by ZIP code, because rents vary sharply within one city. In Los Angeles, for example, FY2026 2-bedroom Small Area FMRs run from $2,070 in ZIP 90058 to $4,350 in ZIP 90210.
In HUD’s Fair Market Rent Documentation System on huduser.gov. Choose the fiscal year, your state and your county, and HUD shows the FMR for every bedroom size, plus how it was calculated. FY2026 is the current schedule in the system.
Key Takeaways
- There is no single US price for a 2 bedroom apartment; HUD’s FY2026 2-bedroom Fair Market Rents run from $937 in Major County, Oklahoma, to $3,604 in the San Francisco metro area.
- An FMR is a gross-rent benchmark (rent plus utilities, except telephone) set at roughly the 40th percentile of standard-quality homes in one defined area, updated every fiscal year.
- Several large metros, including Los Angeles, Phoenix, and Chicago, use Small Area FMRs by ZIP code, so in those cities the honest answer is a ZIP-level figure.
- Fair Market Rent, the Section 8 payment standard (90–110% of the FMR), and the actual contract rent are three different numbers; confusing them leads to bad pricing and bad applications.
- State minimums and a 90%-of-last-year floor shape the published figures — Major County’s $937 is Oklahoma’s state minimum, not its raw calculation of $803.
- Landlords should use the local FMR as a pricing sanity check and renters as a negotiation reference, always converting listings to gross rent before comparing.
Next step: look up your own county or ZIP code in HUD’s documentation system and write the FY2026 figure next to the rent you charge or pay. That one comparison tells you more than any national average ever will.
