

Income Approach vs Sales Comparison Approach: A Worked Example
Two valuation methods can give the same rental property two price estimates—and the gap can change how you negotiate. The income approach estimates value from net operating income (NOI) and a supported capitalization rate. The sales comparison approach starts with similar property sales and adjusts for differences. So which figure should you trust? The answer depends on the strength of the income assumptions, the comparable sales, and the evidence behind each adjustment. In this worked example, we value one hypothetical 10-unit apartment building both ways, show the key calculations, and explain how to reconcile the results without blindly averaging them.
The income approach estimates a property’s value from the income it can reasonably produce. The sales comparison approach estimates value by analyzing recent sales of similar properties and adjusting those prices for meaningful differences. For a rental-property investor, the two methods offer different perspectives: one tests the property’s income-producing capacity, while the other tests the value indicated by market transactions.
In the worked example below, a hypothetical 10-unit apartment building indicates approximately $1.66 million using the income approach and $1.58 million using the sales comparison approach. The difference does not automatically mean that one calculation is wrong. It means the assumptions and evidence need to be checked before drawing a conclusion.
This guide walks through both methods using the same property, shows the calculations, and explains how to interpret the results. All property details, rental figures, cap rates, comparable sales, and adjustments are educational assumptions—not actual transactions or current market benchmarks. The example is not a professional appraisal or a guarantee of what a buyer will pay.
1. Income Approach vs Sales Comparison Approach: The Key Difference
The main difference is the evidence each method emphasizes:
- Income approach: What value does the property’s sustainable income support?
- Sales comparison approach: What have buyers paid for similar properties, after accounting for differences?
Both methods can be relevant to rental property. The right emphasis depends on the type of asset, the reliability of its operating information, the availability of comparable transactions, and the purpose of the valuation. They are not simply “commercial” and “residential” methods; income evidence can be important for residential rentals, and comparable sales can be useful for commercial properties. See Investopedia’s overview of the income approach and Altus Group’s overview of commercial valuation methods.
| Comparison point | Income approach | Sales comparison approach |
| Main evidence | Sustainable income, operating expenses, and a supported capitalization rate | Verified sales of similar properties and supported adjustments |
| Common calculation | Net operating income (NOI) ÷ capitalization rate | Adjusted sale prices or unit prices |
| Most useful when | Income is central to buyer decisions and can be estimated reliably | Recent, genuinely comparable sales are available |
| Main risk | NOI or cap-rate assumptions do not reflect the market or property | Comparables differ materially or adjustments are weakly supported |
| What to verify | Rent, vacancy, normalized expenses, cap-rate evidence, and capital needs | Sale facts, property condition, tenancy, location, rights conveyed, and transaction terms |
A useful valuation does not just produce a number. It explains what evidence supports the number, what assumptions could change it, and how much confidence a decision-maker should place in it.
2. What Is the Income Approach in Real Estate Valuation?
The income approach converts the economic benefits expected from an income-producing property into a value indication. For rental owners, that normally starts with rent and other property income, subtracts vacancy and operating expenses, and then applies a valuation method appropriate to the income stream.
Two common income-approach methods are direct capitalization and discounted cash flow (DCF). Direct capitalization converts a representative annual NOI into a value indication using a capitalization rate. DCF forecasts cash flows over multiple periods and discounts them to a valuation date. They are related, but they are not interchangeable. A helpful overview is available from Agora’s commercial property valuation guide.
The quality of the result depends on the inputs. A rent roll alone is not enough: verify actual leases, concessions, collection history, recurring expenses, vacancy, and the property’s likely capital requirements. For a property with below-market leases, do not assume that market rent can be collected immediately unless the lease terms and timing support that assumption.
For a landlord considering a purchase, the income approach is especially useful as a way to test the asking price against sustainable property operations. It does not, by itself, tell the buyer whether the property meets their personal cash-on-cash return target, financing constraints, or investment objectives.
3. How Do You Calculate Property Value Using the Income Approach Formula?
For direct capitalization, the basic formula is:
Property value = Annual net operating income (NOI) ÷ Capitalization rate
The capitalization rate, often called the cap rate, is expressed as a decimal in the calculation. For example, 6.5% is entered as 0.065.
If a property has annual NOI of $100,000 and market evidence supports a 6.25% cap rate, the indicated value is:
$100,000 ÷ 0.0625 = $1,600,000
The arithmetic is straightforward; selecting a sustainable NOI and a defensible cap rate is the harder part. NOI is generally effective gross income minus property operating expenses. It normally excludes mortgage principal and interest, investor income taxes, and depreciation. Property taxes are operating expenses. Capital expenditures and replacement reserves require clear treatment because conventions can vary by analysis; keep the NOI definition consistent with the cap-rate evidence used.
Do not substitute gross scheduled rent for NOI. If the owner collects $180,000 in potential rent, that is not the same as $180,000 of NOI. Vacancy, credit loss, other income, and operating expenses can materially change the numerator and, therefore, the value indication.
The Investopedia income-approach explanation is a useful background source for the basic concept. In an actual acquisition, document where each input came from, what period it covers, and whether it has been normalized to reflect sustainable operations.
4. When Should You Use Direct Capitalization vs. Discounted Cash Flow?
Direct capitalization is most informative when a property has a relatively stable income stream and one representative annual NOI can reasonably summarize expected operations. It is commonly used as a concise income-based valuation method, provided the cap rate and NOI definition are supported by relevant market evidence.
Discounted cash flow (DCF) may provide more detail when income is expected to change meaningfully over time—for example, when a building has significant lease rollover, a planned renovation, unusual vacancy, a lease-up period, or large future capital costs. A DCF model estimates cash flows by period and may include net sale proceeds at the end of the forecast, then discounts those amounts to the valuation date.
Do not confuse the rates used in the methods:
- A capitalization rate converts a representative annual income amount into a value indication.
- A discount rate converts future cash flows at different dates into present value.
A cap rate should not simply be relabeled as a DCF discount rate. DCF also needs explicit assumptions for the timing of income, expenses, capital spending, and any terminal sale. See Agora’s valuation guide for broader context on direct capitalization and DCF.
For a small landlord assessing a stable rental, direct capitalization may be easier to explain and check. For a property whose income or capital spending is likely to change sharply, a DCF or detailed cash-flow model can expose timing risks that a single stabilized NOI cannot show. The choice should follow the property and the evidence—not which method gives the higher number.
5. What Is the Sales Comparison Approach in Real Estate?
The sales comparison approach estimates value from completed transactions involving similar properties. The analyst identifies relevant comparable sales, verifies the transaction details, compares each property with the subject, and adjusts the sale prices for material differences that affect value.
Potential comparison factors include location, sale date, building and unit size, unit mix, condition, occupancy, lease terms, property rights conveyed, transaction concessions, and unusual sale circumstances. Price per unit or price per square foot can help organize the evidence, but those metrics are starting points rather than automatic conclusions. A ten-unit building with older interiors and below-market leases may not be directly equivalent to a recently renovated building with stronger rents just because both have ten apartments.
The approach is most persuasive when the transactions are recent enough, similar enough, and sufficiently verified to represent the market for the subject property. If relevant sales are scarce, the resulting value indication may depend heavily on adjustments and should be treated with appropriate caution.
For rental investors, the sales comparison approach is a useful market check on the income approach. It asks whether buyers have paid prices consistent with the value implied by the subject’s rental performance. Differences between the methods are a reason to investigate the underlying evidence, not to choose a favorite method automatically.
6. How Do You Select and Adjust Comparable Property Sales?
Start with sales that are genuinely competitive substitutes for the property being valued. A useful comparable is not simply a nearby building or one with the same number of apartments. Consider whether buyers would view it as a similar alternative in location, property type, size, condition, tenancy, and income potential.
Then verify the sale price, transaction date, property details, rights conveyed, concessions, and any circumstances that may have affected the price. Listings and asking prices can provide context, but they are not the same evidence as verified closed transactions.
The direction of an adjustment is important:
- A superior comparable generally receives a downward adjustment to reflect that it has an advantage the subject does not have.
- An inferior comparable generally receives an upward adjustment to reflect that the subject has an advantage over it.
For example, if a comparable has recently renovated interiors and the subject has dated finishes, a downward adjustment to the comparable may be appropriate. The amount should be grounded in market evidence, not simply the seller’s renovation budget or an arbitrary percentage. Likewise, adjustments for location, tenancy, or sale timing need support.
After adjustments, consider the reliability of each comparable. A sale with well-documented facts and few significant adjustments may deserve more consideration than a sale that requires several uncertain adjustments. Do not assign mechanical weights merely because three comparables are available; explain why the evidence is more or less persuasive. Altus Group’s valuation-method overview provides additional context on the role of market transactions in valuation.
7. Worked Example: How Do You Value the Same Rental Property Using Both Approaches?
To compare the methods fairly, use the same subject property and valuation assumptions. Imagine a hypothetical, stabilized 10-unit apartment building in the United States. The figures below are invented for instruction and do not represent a specific city, actual sale, or current market benchmark.
| Input | Hypothetical assumption |
| Number of apartments | 10 |
| Average monthly rent per apartment | $1,500 |
| Annual potential apartment rent | $180,000 |
| Vacancy and credit loss | 5% of potential apartment rent |
| Other annual income | $6,000 |
| Annual operating expenses | $69,000 |
| Illustrative capitalization rate | 6.50% |
The example also assumes that the other income is already a reasonable collectible estimate; the stabilized income estimate is consistent with the lease assumptions; no extraordinary deferred maintenance or lease-up adjustment is required; and the income analysis and comparable sales relate to the same property interest and valuation date.
In real work, those assumptions must be investigated, not accepted just because they make the arithmetic easy. Review the current rent roll, executed leases and amendments, historical operating statements, tax and insurance records, maintenance history, capital needs, and market evidence. Be especially careful if existing leases are below or above market, because the income available to the owner may depend on contractual rights and timing.
We will first calculate the income value and then estimate a sales-comparison value from three hypothetical sales. Finally, we will investigate the difference rather than treating either result as automatically correct.
8. How Do You Calculate Effective Gross Income and Net Operating Income (NOI)?
Effective gross income is the income remaining after the modeled vacancy and credit loss, plus other income included in the analysis. For this example, the 5% loss is applied to potential apartment rent; the $6,000 of other income is assumed to be an effective, collectible estimate.
Step 1: Calculate potential apartment rent.
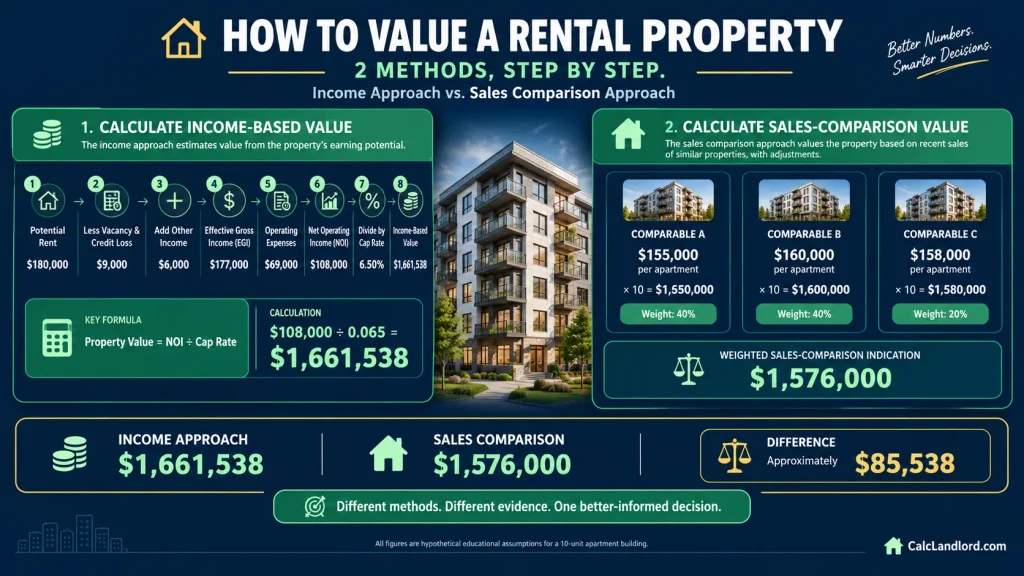
10 apartments × $1,500 per month × 12 months = $180,000
Step 2: Calculate vacancy and credit loss.
$180,000 × 5% = $9,000
Step 3: Calculate effective gross income (EGI).
$180,000 − $9,000 + $6,000 = $177,000
| Income item | Annual amount |
| Potential apartment rent | $180,000 |
| Less: vacancy and credit loss | −$9,000 |
| Plus: effective other income | $6,000 |
| Effective gross income | $177,000 |
Next, subtract normalized operating expenses. In a real analysis, check whether the numbers reflect sustainable expenses rather than a seller’s unusually low spending in one year.
| Operating expense | Annual amount |
| Property taxes | $22,000 |
| Insurance | $8,000 |
| Repairs and routine maintenance | $12,000 |
| Property management | $9,000 |
| Owner-paid utilities | $10,000 |
| Administration, landscaping, and other operations | $8,000 |
| Total operating expenses | $69,000 |
Step 4: Calculate net operating income.
$177,000 EGI − $69,000 operating expenses = $108,000 NOI
This example excludes mortgage payments and the owner’s income taxes from NOI. It also treats major capital replacements separately from routine maintenance. That does not mean capital needs are unimportant; they should be considered in the appropriate valuation or cash-flow analysis and in a consistent way relative to the cap-rate evidence.
9. How Do You Estimate Rental Property Value Using a Capitalization Rate?
For the worked example, assume that relevant market evidence supports a 6.50% capitalization rate. This is an illustrative input, not a claim about the right cap rate for a market or property type today.
The direct-capitalization calculation is:
Value = NOI ÷ Cap rate
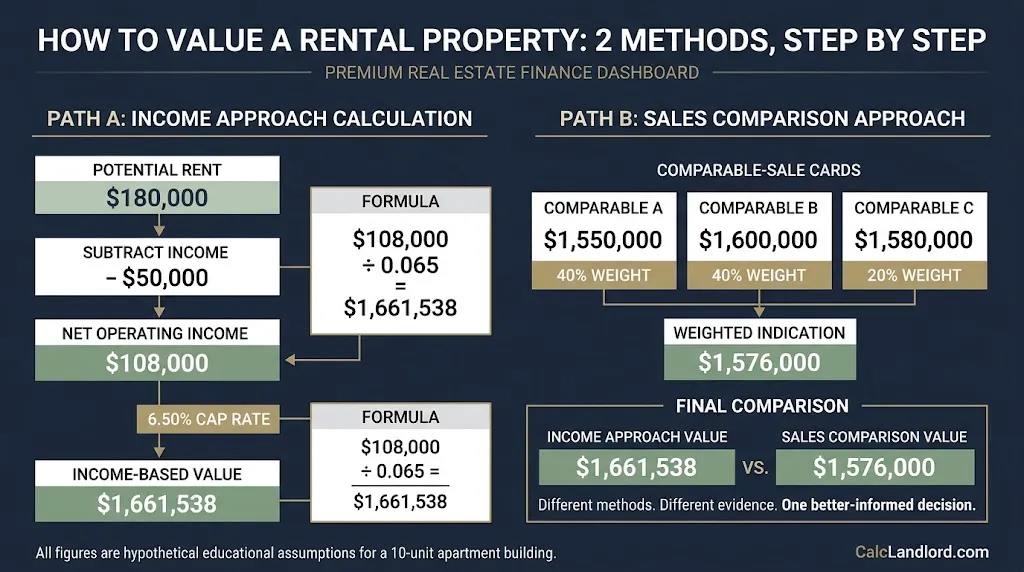
$108,000 ÷ 0.065 = $1,661,538 (rounded to the nearest dollar)
The income approach therefore indicates approximately $1.66 million.
The result is sensitive to both the NOI and the cap rate. If expenses are understated, rents are unrealistic, vacancy is too low, or the cap rate does not match the property’s risk and income convention, the value can be misleading even though the arithmetic is correct.
A defensible cap rate should be supported by relevant market evidence and used with a consistent income measure. For example, a cap rate derived from sales using one NOI convention should not be applied casually to a different income measure that includes or excludes different costs. Document whether the NOI is trailing, forward, or stabilized, and disclose how replacement reserves and capital needs are handled. For background, see Investopedia’s income-approach article and Altus Group’s valuation-method overview.
10. How Do You Calculate Property Value Using Adjusted Comparable Sales?
Now estimate the same building’s value using three hypothetical apartment-building sales. Begin with price per apartment, then apply illustrative adjustments for location and condition. The sales, prices, and adjustments are all made up for this example.
| Comparable | Apartments | Hypothetical sale price | Unadjusted price per apartment |
| A | 10 | $1,600,000 | $160,000 |
| B | 12 | $1,860,000 | $155,000 |
| C | 8 | $1,320,000 | $165,000 |
The simplified adjustment grid assumes that the adjustment amounts below have already been supported by market evidence. Adjustments are shown per apartment so that the results can be applied to the 10-unit subject.
| Adjustment per apartment | Comp A | Comp B | Comp C |
| Location | $0 | +$3,000 | −$2,000 |
| Condition | −$5,000 | +$2,000 | −$5,000 |
| Net adjustment | −$5,000 | +$5,000 | −$7,000 |
| Unadjusted price per apartment | $160,000 | $155,000 | $165,000 |
| Adjusted price per apartment | $155,000 | $160,000 | $158,000 |
| Indication for the 10-unit subject | $1,550,000 | $1,600,000 | $1,580,000 |
The adjustment logic is as follows:
- Comparable A: Its condition is assumed superior to the subject’s, so its price is adjusted downward by $5,000 per apartment.
- Comparable B: Its location and condition are assumed inferior to the subject’s, so it receives upward adjustments totaling $5,000 per apartment.
- Comparable C: Its location and condition are assumed superior to the subject’s, so it receives downward adjustments totaling $7,000 per apartment.
In a real valuation, the analyst would also examine scale, unit mix, sale date, concessions, lease terms, occupancy, property rights, financing or transaction circumstances, and other material differences. Unit count alone does not make buildings comparable, and price per apartment can conceal major differences in unit size or quality. The simplified grid intentionally holds those other factors constant to make the adjustment process visible.
For this exercise, assume Comparables A and B deserve more consideration because their transaction details are better verified. Apply illustrative weights of 40%, 40%, and 20% to A, B, and C respectively:
(155,000×40%)+(160,000 × 40%) + ($158,000 × 20%) = $157,600 per apartment
$157,600 × 10 apartments = $1,576,000
The sales comparison approach therefore indicates approximately $1.58 million. These weights are teaching assumptions, not a standard formula. In actual work, the relative importance of each comparable should be explained by the quality and relevance of its evidence.
11. How Do You Reconcile the Income Approach and Sales Comparison Results?
The two indications in the example are:
| Approach | Indicated value |
| Income approach | $1,661,538 |
| Sales comparison approach | $1,576,000 |
| Difference | $85,538 |
The income indication is approximately 5.4% higher than the sales comparison indication, using the sales indication as the comparison base. Before selecting a conclusion, investigate the cause of the gap.
Ask whether the $108,000 NOI is sustainable; whether the 6.50% cap rate matches the income period and reserve convention; whether the comparable sales are competitive substitutes; whether the adjustments are supported; and whether both approaches value the same property interest on the same date.
For an illustrative investment-analysis exercise only, suppose the income evidence is judged to deserve 60% weight and the adjusted sales evidence 40% weight:
(1,661,538×60%)+(1,576,000 × 40%) = approximately $1,627,323
That rounds to about $1.63 million. This weighted figure is a teaching illustration—not an appraisal conclusion established by real market evidence. Weighting must reflect evidence quality; it cannot make weak inputs reliable.
Do not assume that two approaches should always be averaged. Reconciliation is a reasoned assessment of how applicable and reliable each indication is. The Fannie Mae Selling Guide’s valuation analysis and reconciliation guidance illustrates the importance of explaining reconciliation in residential appraisal work; its requirements should not be treated as a universal rule for every commercial valuation or investment analysis.
For a landlord deciding what to offer, keep three questions separate: what market value the evidence supports, what the property is worth to this particular buyer under their assumptions, and what purchase price is affordable given financing and required returns. Those amounts may differ.
12. Why Do the Two Property Valuation Approaches Produce Different Values?
A gap between approaches can reveal different assumptions rather than a simple arithmetic error. The most common causes deserve a deliberate check.
The income estimate may be optimistic
A seller’s projections may assume rent increases that are not supported by local evidence, lower vacancy than the property can sustain, or expenses below normalized levels. Review leases and actual collections, not just asking rents or a broker’s projection.
The cap rate may not match the property
A rate drawn from recently renovated, well-leased buildings may not suit an older property with a near-term capital requirement or less reliable income. At the same NOI, a lower cap rate produces a higher value indication, while a higher cap rate produces a lower value indication.
The comparable sales may not be close substitutes
Two apartment buildings can have the same number of units yet differ in unit mix, size, location, lease terms, maintenance, tenant profile, or operating costs. Price per unit does not remove the need to analyze those differences.
The income and sales evidence may reflect different dates or definitions
A current stabilized-income estimate compared with older transactions may need market-condition analysis. Similarly, applying a rate derived from one NOI convention to an NOI prepared under another convention can introduce a mismatch.
The property rights may differ
The rights conveyed in a transaction and the leases affecting the subject can matter. A property with enforceable below-market rents may not deliver the same near-term income as a property with market rents. An analyst should not simply substitute market rent for contract rent without considering the relevant lease terms, rights, and timing.
The practical lesson is to treat disagreement as a diagnostic signal. Trace each figure back to its source, test key assumptions, and determine which method is best supported before choosing a conclusion.
13. How Do Changes in NOI and Cap Rates Affect Property Value?
Sensitivity analysis shows how value changes when important assumptions change. It does not predict the probability of each outcome; it helps an investor understand how dependent the result is on inputs that may be uncertain.
The table below uses the example’s $108,000 base NOI and tests NOI 10% lower and 10% higher, alongside three hypothetical cap rates. Each value is calculated as NOI divided by the cap rate and rounded to the nearest dollar.
| Annual NOI | At 6.00% cap rate | At 6.50% cap rate | At 7.00% cap rate |
| $97,200 (10% below base) | $1,620,000 | $1,495,385 | $1,388,571 |
| $108,000 (base case) | $1,800,000 | $1,661,538 | $1,542,857 |
| $118,800 (10% above base) | $1,980,000 | $1,827,692 | $1,697,143 |
At the base NOI, increasing the cap rate from 6.50% to 7.00% reduces indicated value from about $1,661,538 to $1,542,857—a decrease of approximately $118,681. A 10% reduction in NOI at a 6.50% cap rate lowers the indicated value to about $1,495,385.
Use sensitivity testing to identify the assumptions that deserve the most attention. If a small change in vacancy, expenses, or the cap rate materially changes the investment case, verify those inputs before making an offer. A calculated value may be exact to the dollar while the estimates behind it remain uncertain.
For acquisition analysis, consider a separate operating cash-flow model for mortgage payments, one-time repairs, replacement reserves, closing costs, and other buyer-specific expenses. Those items may be outside the direct-capitalization formula, but they can still materially affect the investment’s attractiveness.
14. Which Valuation Approach Should Landlords and Real Estate Investors Use?
Choose the approach based on the property and the evidence available—not on which one produces the highest number.
| Property situation | Practical emphasis |
| Stabilized rental building with reliable operating records | Income analysis, cross-checked against adjusted comparable sales |
| Recent, genuinely comparable closed sales are available | Sales comparison can provide persuasive market evidence |
| Property has a major lease-up, renovation, or income transition | Consider DCF to make timing and capital assumptions explicit |
| Few relevant comparable transactions exist | Give greater scrutiny to income evidence and consider whether another method adds useful support |
| New, unusual, or specialized property | Consider whether a cost approach or other evidence is relevant to the assignment |
For a typical landlord, use both methods when the available information supports both. The income approach helps answer whether the asking price makes sense given sustainable earnings. The sales comparison approach checks the result against market transactions. If one method rests on much weaker evidence, explain that limitation instead of giving both methods equal weight by default.
Documents to verify before relying on a value
Collect the current rent roll, executed leases and amendments, historical operating statements, property-tax and insurance records, utility bills, maintenance history, capital-expenditure history, relevant title or property-rights information, and verified details for comparable sales. Also document the source and date for market rent, vacancy assumptions, the cap rate, and each major adjustment.
Create a simple input log with four columns: assumption, source, date, and reason for adjustment. It makes the analysis reviewable and helps you identify whether a later change in value came from actual property performance, new sale evidence, or revised assumptions.
A practical decision framework
- Verify the facts. Reconcile rent rolls and leases with collections and expenses.
- Normalize the operations. Estimate sustainable vacancy, other income, and operating expenses; identify capital needs separately.
- Calculate the income indication. Use a cap rate supported by relevant evidence and consistent with the NOI definition.
- Analyze comparable sales. Verify transactions and adjust for meaningful differences.
- Explain the gap. Identify which assumptions drive the difference between the indications.
- Test downside scenarios. Check how lower NOI, higher cap rates, unexpected repairs, or lease-up delays change the outcome.
- Separate value from your offer. Account for financing, acquisition costs, planned capital work, investment objectives, and required returns.
If the transaction requires a formal appraisal, lending valuation, legal opinion, or tax determination, use an appropriately qualified professional. This educational example is not a substitute for an appraisal or individualized financial, tax, legal, or accounting advice.
15. What Are the Most Common Property Valuation Mistakes, and What Questions Should Investors Ask?
Valuation mistakes often arise from inconsistent inputs or unsupported assumptions—not from the final division or multiplication. Before relying on a result, check for the following problems.
Common valuation mistakes
Using gross rent instead of NOI. Capitalizing $180,000 of potential rent is not equivalent to capitalizing the example’s $108,000 NOI. The income measure must match the method and rate being used.
Choosing the cap rate to justify a desired price. Select and support the rate from relevant market evidence rather than solving backward from the seller’s asking price.
Treating unadjusted prices per unit as final values. Price per apartment or square foot is a comparison aid. Differences in location, unit mix, condition, occupancy, and leases may still require analysis.
Ignoring capital needs because they are excluded from NOI. Major replacements may be treated separately from routine operating expenses, but they still affect cash flow, risk, and what a buyer can afford to pay.
Mixing property value with equity value. A property-level value is not the same as the owner’s equity after debt. A model that uses equity cash flows incorporates financing effects and should not be described as an unlevered property value.
Automatically averaging conflicting results. A midpoint cannot fix weak evidence. Explain why one indication is more reliable or why both deserve consideration.
People Also Ask
Not automatically. The income approach can be persuasive when the property has reliable income and a well-supported cap rate. Sales comparison can be persuasive when recent, relevant transactions are available and adjustments are well supported. Reliability depends on the property, evidence, and purpose of the analysis.
For direct capitalization, Property value = annual NOI ÷ capitalization rate. DCF is a different income method that models cash flows across multiple periods and discounts them to a valuation date.
Adjust the comparable toward the subject. A comparable that is superior to the subject generally receives a downward adjustment; an inferior comparable generally receives an upward adjustment. The adjustment amount should be supported by market evidence.
No. A cap rate converts a representative annual income amount into a value indication. A discount rate converts future cash flows at different dates into present value. They serve different purposes.
It can contribute to a market-value opinion when the income, capitalization rate, and other assumptions reflect relevant market evidence. It is also used for investment analysis, but an individual buyer’s investment value may differ from a market-value conclusion.
Current NOI may not adequately represent the property’s value if it is vacant or undergoing lease-up. Analyze relevant sales or other valuation evidence and, where appropriate, model downtime, leasing costs, renovations, and future cash flows. Do not assume full market rent begins immediately without support.
Key takeaways and next steps
The income approach and sales comparison approach answer different questions, so their results do not need to match exactly. For the hypothetical 10-unit building, direct capitalization indicates approximately $1.66 million, while adjusted comparable sales indicate approximately $1.58 million. The gap should trigger a review of NOI, the cap rate, comparable quality, adjustment support, and consistency of the valuation assumptions.
Before making a rental-property decision, verify the underlying records, run sensitivity tests, and keep market value separate from your own investment return and offer price. The CalcLandlord Cap Rate Calculator is the most relevant next tool for testing how different cap-rate assumptions affect the income indication; use the live calculator URL after verifying it on the site. A cash-flow or NOI calculator can support the next stage of underwriting, but no calculator can replace reliable inputs or professional appraisal judgment.
