
Break-Even Occupancy Rate: Formula, Calculator & Rental Property Example
Every rental property has a tipping point. Fill enough units and the rent covers everything. Fall below it and you start writing checks out of your own pocket.
That tipping point is your break-even occupancy rate. It tells you how much vacancy a property can absorb before it stops paying for itself. It’s one of the fastest ways to judge how risky a rental deal really is.
This guide covers the formula, a full multifamily example, a single-family example, how to read the result, how to stress-test it, and how to lower it.
What Is the Break-Even Occupancy Rate? (Quick Answer)
The break-even occupancy rate is the minimum percentage of a property’s gross potential rent that must be collected to cover operating expenses and annual debt service. Above it, the property produces positive cash flow. Below it, the property loses money.
Formula:
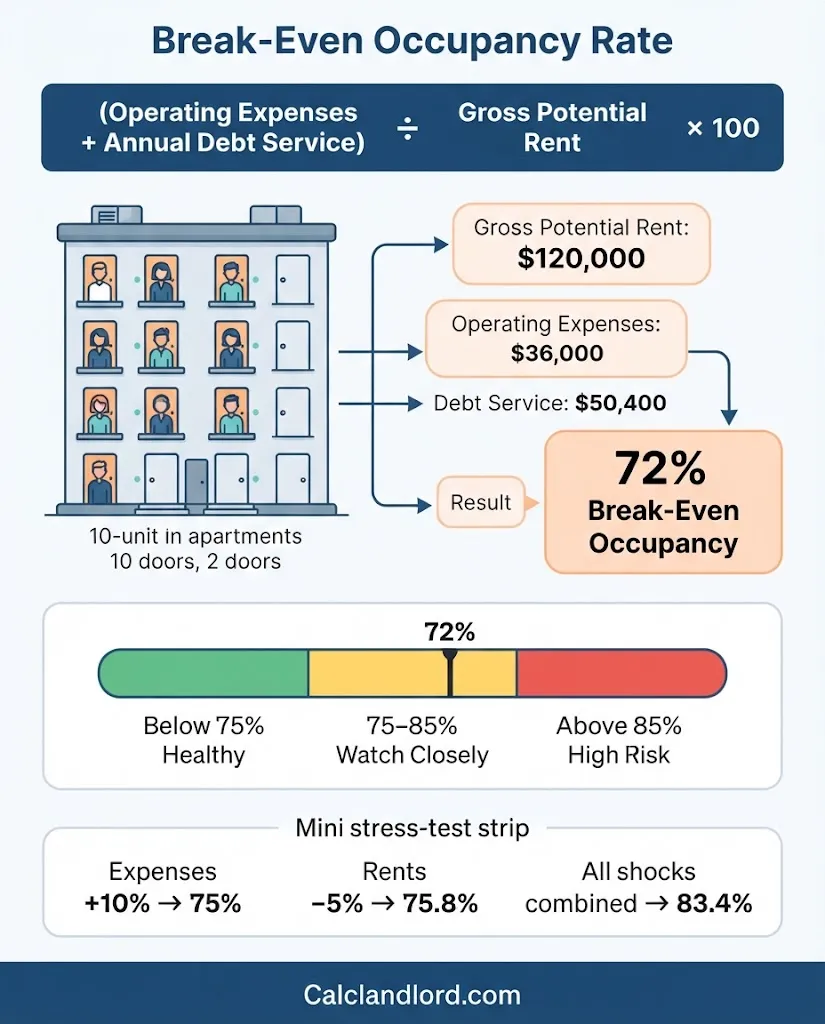
Break-Even Occupancy Rate = (Operating Expenses + Annual Debt Service) ÷ Gross Potential Rent × 100
If a building breaks even at 72%, it can sit 28% empty (or equivalent lost rent) and still pay every bill and the mortgage.
Want to skip the math? Plug your numbers into the Break-Even Occupancy Calculator and compare the result against the examples below.
Why Break-Even Occupancy Matters
Cap rate and cash-on-cash return tell you how a property performs when things go well. Break-even occupancy tells you how much room you have when things go badly.
It matters because:
• It measures your margin of safety. The gap between your break-even and your realistic occupancy is your cushion.
• It exposes leverage risk. Two properties with identical rent can have very different break-even points if one carries a bigger loan.
• Lenders use similar logic. Underwriters stress-test whether income can still cover debt payments if occupancy drops. Break-even occupancy and debt service coverage ratio (DSCR) are two views of the same question.
• It makes vacancy tangible. Saying “we can lose 2.8 units” is easier to act on than a percentage.
The Break-Even Occupancy Formula Explained
| Variable | What it means | What to include |
| Operating expenses | Annual cost of running the property | Property taxes, insurance, repairs and maintenance, utilities you pay, property management, landscaping, snow removal, admin and software |
| Annual debt service | Total mortgage payments for the year | Principal and interest, plus any other required loan payments. Never interest alone |
| Gross potential rent (GPR) | Rent at 100% occupancy and market rates | Number of units × market rent × 12 |
Three details trip people up:
1. Don’t use current collections as the denominator. Gross potential rent is the full-occupancy number. If you use actual rent, you’re measuring something else.
2. Mortgage principal counts. It isn’t a tax-deductible expense, but it’s a real cash payment. Break-even occupancy is a cash metric.
3. Operating expenses are treated as fixed in the basic formula. In reality, some costs (like a percentage-based management fee) move with income. The simple version is still the industry-standard shortcut. Just remember it slightly overstates risk when part of your costs scale with rent.
How to Calculate Break-Even Occupancy: Step by Step
1. Calculate gross potential rent: units × monthly market rent × 12.
2. Add up annual operating expenses. Use real numbers from a trailing 12-month statement, not a seller’s pro forma.
3. Add annual debt service: monthly mortgage payment × 12.
4. Add operating expenses and debt service to get total required income.
5. Divide by gross potential rent and multiply by 100.
Rental Property Example: 10-Unit Apartment Building
Say you’re evaluating a 10-unit building with these numbers:
| Assumption | Amount |
| Units | 10 |
| Average market rent | $1,000/month |
| Gross potential rent (annual) | $120,000 |
| Annual operating expenses | $36,000 |
| Annual debt service | $50,400 |
Step 1: Gross potential rent. 10 × $1,000 × 12 = $120,000
Step 2: Required income. $36,000 + $50,400 = $86,400
Step 3: Divide. $86,400 ÷ $120,000 = 0.72, so the break-even occupancy rate is 72%.
4: Convert to units. 10 units × 72% = 7.2 units. You can’t rent 0.2 of a unit, so you need 8 occupied units to be safely above break-even. Eight units at $1,000 for 12 months brings in $96,000, which clears the $86,400 requirement by $9,600.
The monthly view. Many landlords think monthly. Required income is $86,400 ÷ 12 = $7,200 per month against $10,000 of potential rent.
What This Looks Like at Different Occupancy Levels
| Occupancy | Rent collected | Operating expenses | NOI | Debt service | Cash flow | DSCR |
| 95% | $114,000 | $36,000 | $78,000 | $50,400 | +$27,600 | 1.55 |
| 85% | $102,000 | $36,000 | $66,000 | $50,400 | +$15,600 | 1.31 |
| 72% | $86,400 | $36,000 | $50,400 | $50,400 | $0 | 1.00 |
| 65% | $78,000 | $36,000 | $42,000 | $50,400 | −$8,400 | 0.83 |
Notice the DSCR column. At break-even occupancy, net operating income exactly equals debt service, so DSCR is 1.00. That’s the link between the two metrics.
Single-Family Rental Example
Break-even occupancy works on one door, but you’ll think in months instead of units.
| Assumption | Annual amount |
| Rent ($2,200/month) | $26,400 |
| Property taxes | $3,200 |
| Insurance | $1,400 |
| Maintenance and repairs | $1,600 |
| Property management | $2,100 |
| Other (lawn, software, misc.) | $500 |
| Total operating expenses | $8,800 |
| Debt service ($210,000 loan, 7%, 30 years, about $1,397/month) | $16,765 |
Calculation: ($8,800 + $16,765) ÷ $26,400 = 96.8%
That means the house must be rented about 11.6 months out of 12. You could absorb roughly 11 days of vacancy a year before going negative. One slow turnover, one surprise water heater, and the deal is in the red.
This is the kind of thing a quick cash flow check can hide. A single-family rental with a positive monthly number can still have almost no margin for error. Compare this result with your rental property cash flow and cash-on-cash return numbers before you buy.
What Is a Good Break-Even Occupancy Rate?
Lower is safer. There’s no universal cutoff, but these rules of thumb are a useful starting point:
| Break-even occupancy | General interpretation |
| Below 65% | Strong cushion. Double-check that expenses or debt aren’t understated |
| 65%–75% | Healthy. Meaningful protection against vacancy |
| 75%–85% | Workable in stable markets, but stress-test carefully |
| Above 85% | Thin margin. Small shocks can push cash flow negative |
These are judgment ranges, not regulatory standards. What counts as “good” depends on:
• Local vacancy. An 80% break-even is comfortable where similar buildings run 95% occupied and risky where the submarket runs 82%.
• Property size. In a 4-unit building, one vacancy is 25% of your income. In a 100-unit building, it’s 1%.
• Leverage. A higher loan-to-value pushes break-even up.
• Tenant stability and lease terms. Longer leases and lower turnover reduce risk.
• Your reserves. Cash in the bank lets you survive months below break-even.
The most useful comparison is your break-even occupancy against realistic market occupancy. A wide gap is what makes a deal durable.
Break-Even Occupancy vs. DSCR
| Break-even occupancy | DSCR | |
| Question | How full must the property be to cover everything? | How many times does NOI cover the loan payment? |
| Formula | (OpEx + Debt Service) ÷ GPR | NOI ÷ Debt Service |
| Reads best as | A vacancy tolerance | A lender-style coverage test |
| Break-even point | The occupancy where income covers all costs | DSCR = 1.00 |
Lenders typically want DSCR comfortably above 1.00. Many commercial and investor loan programs look for something in the 1.20–1.25 range, though requirements vary by lender and loan type, so check your own term sheet. In occupancy terms, a lender wanting 1.25x is effectively asking you to prove the property works with a healthy buffer above break-even. Use the DSCR calculator to see the same property from the lender’s side.
Physical vs. Economic Occupancy
Break-even occupancy is about dollars, so compare it to economic occupancy:
• Physical occupancy: the share of units with a tenant in them.
• Economic occupancy: the share of potential rent you actually collect.
A building can be 100% physically occupied and still sit below break-even if tenants are on free-rent concessions, paying below-market rent, or not paying at all. Track collections, concessions, and delinquency alongside your occupancy count. If late payments are a recurring issue, review your tenant screening process and eviction timelines too, since a non-paying tenant hurts as much as an empty unit.
Stress-Testing Your Break-Even Rate
A single break-even number is a snapshot. Investors who last test it against bad scenarios. Using the 10-unit example (base case: 72%):
| Scenario | Change | New required income | New GPR | Break-even |
| Base case | None | $86,400 | $120,000 | 72.0% |
| Expenses rise 10% | OpEx $36,000 → $39,600 | $90,000 | $120,000 | 75.0% |
| Market rents fall 5% | GPR $120,000 → $114,000 | $86,400 | $114,000 | 75.8% |
| Debt service rises 10% (variable-rate or refinance) | $50,400 → $55,440 | $91,440 | $120,000 | 76.2% |
| All three at once | Combined | $95,040 | $114,000 | 83.4% |
No single shock is fatal here. The combined scenario jumps the break-even to 83.4%, which would leave very little room if the market vacancy runs near 10%. Run your own version of this table before you close on a deal.
Adding reserves. Standard NOI often excludes capital expenditures, but roofs, HVAC, and parking lots wear out regardless. If you set aside reserves of 5% of gross rent ($6,000 a year) in the 10-unit example:
($36,000 + $50,400 + $6,000) ÷ $120,000 = 77%
That’s a more conservative and arguably more honest number. Whichever way you do it, apply it consistently across every deal you compare, and check how your lender defines it if a covenant is involved.
How to Lower Your Break-Even Occupancy
You have three levers: cut expenses, cut debt service, or raise potential rent.
Reduce operating expenses
• Rebid insurance, landscaping, and other vendor contracts periodically.
• Reduce turnover with prompt maintenance and fair renewal pricing, because turnover costs add up through vacancy, cleaning, and marketing.
Check your property tax assessment against comparable properties. Appeal procedures vary by county and state.
• Fix recurring waste, such as leaking fixtures or inefficient lighting, when the payback is clear.
Reduce debt service
• Refinance if rates and closing costs make sense. In the 10-unit example, cutting annual debt service from $50,400 to $46,800 lowers break-even from 72% to 69%.
• Put more money down or make principal prepayments on the next deal.
• Be careful with interest-only periods. Break-even can jump once amortization starts.
Raise gross potential rent
• Move below-market units toward market rent at renewal. A 5% rent increase in the example lowers break-even from 72% to about 68.6%.
• Add legitimate income such as parking, storage, laundry, or pet rent where local rules allow it.
• Make improvements only when the added rent comfortably exceeds the cost.
One caution: use real market rents. Inflated rent assumptions make break-even look artificially low, and that’s the most common way this metric gets abused in a sales pitch.
Break-Even Occupancy for Short-Term Rentals
Short-term rentals work differently because costs are tied to booked nights. Use a contribution-margin approach:
Break-Even Nights = Annual Fixed Costs ÷ (Average Nightly Rate − Variable Cost per Booked Night)
Break-Even Occupancy = Break-Even Nights ÷ 365 × 100
Example: Fixed costs (mortgage, taxes, insurance, subscriptions, base utilities) are $43,400 a year. Your average nightly rate is $200, and variable costs (cleaning, supplies, platform fees, extra utilities) run $63 per booked night.
• Contribution per night: $200 − $63 = $137
• Break-even nights: $43,400 ÷ $137 ≈ 317 nights
Break-even occupancy: 317 ÷ 365 ≈ 86.8%
That’s a steep hurdle, and it’s why short-term rentals can look great on peak-season revenue and still disappoint over a full year. Always test seasonality, because a property that books at 95% in summer and 55% in winter needs to average above break-even across the whole year. Local short-term rental rules, permits, and taxes vary widely, so confirm requirements with your city or county before you underwrite.
Common Mistakes to Avoid
• Using actual rent as the denominator. Use gross potential rent at market rates.
• Leaving out principal. Debt service means the full loan payment.
• Underestimating expenses. Use trailing 12-month actuals and verify taxes and insurance, since both can reset after a purchase.
• Skipping reserves. Ignoring capital expenses makes the number look better than the property really is.
• Trusting a pro forma. Seller projections often use optimistic rents and thin expense lines.
• Comparing against physical occupancy only. Concessions and non-payment count.
• Running it once. Recalculate annually and before any refinance, rent change, or major repair.
• Treating break-even as a goal. It’s a downside floor. A property that lives at break-even has no room for anything to go wrong.
Using the Break-Even Occupancy Calculator
The calculator on Calclandlord.com does the arithmetic so you can focus on the scenarios. Enter your gross potential rent, annual operating expenses, and annual debt service, and it returns your break-even occupancy and the number of units you need filled.
Run each deal three ways: your expected case, a conservative case (higher expenses, lower rent), and a worst case. If a property only works in the first scenario, that tells you something important. Pair the results with the cap rate calculator, the rental property ROI calculator, and your mortgage payment calculator to get a complete picture.
People Also Ask
Lower is better. Many investors feel comfortable at 65%–75%, and ratios above roughly 85% leave little room for vacancy or surprise costs. The right target depends on your local market’s vacancy rate, loan terms, and property size.
Add annual operating expenses and annual debt service, divide by gross potential rent, and multiply by 100. For example, ($36,000 + $50,400) ÷ $120,000 × 100 = 72%.
It can be acceptable if the market runs at 95% or higher and the property has stable tenants and reserves. If actual occupancy is only 83%, you have almost no margin for error.
Yes. It includes the full annual debt service, both principal and interest. Leaving out principal understates the true cash requirement.
Many investors do, because major repairs are inevitable. Standard NOI often excludes capital reserves, so choose one method, apply it consistently, and check how your lender defines the ratio.
Break-even occupancy tells you how full the property must be to cover all costs. DSCR tells you how many times NOI covers the loan payment. At break-even occupancy, DSCR equals 1.00.
Can a fully occupied building be below break-even?
Yes. Free rent, below-market leases, and unpaid rent can leave economic occupancy lower than physical occupancy.
How do I lower my break-even occupancy?
Reduce operating expenses, refinance or restructure debt to cut payments, and raise rents toward true market levels. Each lever reduces the income you need or increases the income available.
How do you calculate break-even occupancy for short-term rentals?
Divide annual fixed costs by the nightly rate minus variable cost per booked night to get break-even nights, then divide by 365. Short-term rentals usually need a higher break-even occupancy than long-term rentals because of per-booking costs.
Key Takeaway
Break-even occupancy rate answers a simple question: how empty can this property get before it loses money? Calculate it with operating expenses plus annual debt service, divided by gross potential rent, then compare it with realistic local occupancy and stress-test the result.
A great rental deal isn’t just one with a low break-even number. It has a wide, durable gap between break-even and what the market actually delivers. Tax and lending rules vary by state and lender, so confirm specifics with a qualified CPA, attorney, or lender before making decisions.

Pingback: Split Pay Rent Fairly: 5 Ways to Stop Roommate Fights