
Gross Rent Multiplier (GRM): Formula, Example & Uses
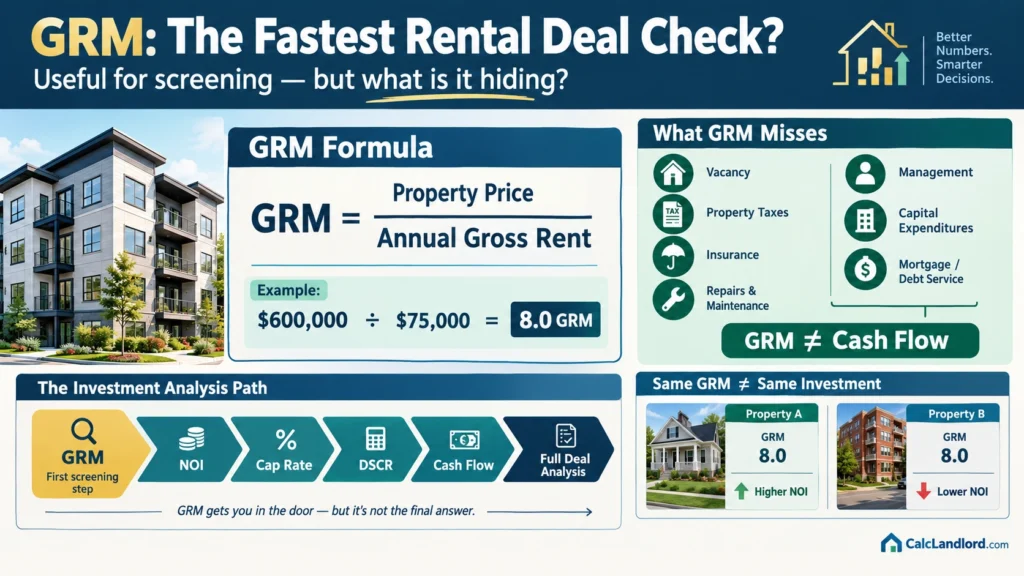
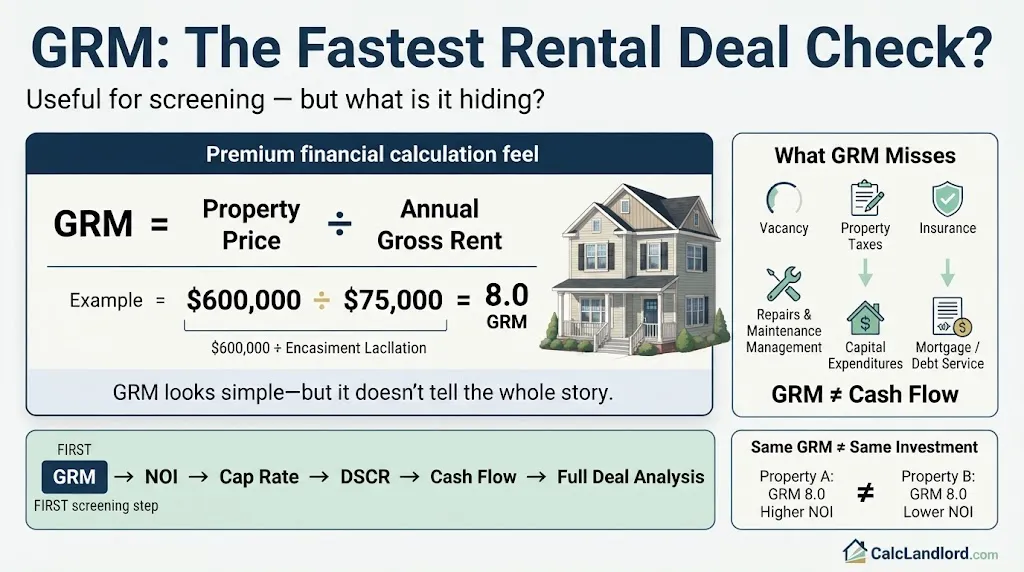
A rental property can look like a great deal—until you look beyond the rent. That is exactly why the Gross Rent Multiplier (GRM) matters. In seconds, GRM can show how a property’s price compares with its annual gross rental income. But there is a catch: GRM ignores many of the costs that determine whether you actually make money. Two properties can have the same GRM and produce dramatically different results after taxes, insurance, repairs, vacancy, management, and financing. In this guide, you’ll learn the GRM formula, work through real rental-property examples, see how investors use it, and discover when GRM can lead you in the wrong direction.
The Gross Rent Multiplier (GRM) is one of the quickest ways to compare a rental property’s price with the gross rent it produces. Investors can calculate it in seconds and use it to screen listings, compare similar properties, estimate a preliminary value, or determine how much rent a property would need to support a target price.
But GRM is easy to misuse.
A property with a low GRM can still have weak cash flow if it has high property taxes, expensive insurance, heavy maintenance, poor collections, large capital needs, or unfavorable financing. GRM also does not tell you whether a property meets a lender’s debt-service requirements.
The standard formula is:
GRM = Property Price or Market Value ÷ Annual Gross Rental Income
For serious rental-property analysis, think of GRM as a first-pass screening tool, not a complete investment-return metric.
Quick Answer: What Is Gross Rent Multiplier?
The Gross Rent Multiplier compares a property’s price or market value with its annual gross rental income.
Formula:
GRM=Property PriceAnnual Gross Rent\text{GRM}=\frac{\text{Property Price}}{\text{Annual Gross Rent}}
For example, suppose a rental property sells for $600,000 and generates $75,000 in annual gross rent.
GRM=$600,000$75,000=8.0\text{GRM}=\frac{\$600,000}{\$75,000}=8.0
The property has an 8.0 GRM.
A lower GRM means you are paying less property value for each dollar of gross rent, all else equal. However, a lower GRM does not automatically mean the property is a better investment, because GRM does not account for operating expenses, vacancy and collection problems, financing, capital expenditures, or taxes.
J.P. Morgan describes GRM as a quick comparison tool and notes that an appropriate GRM varies by market, property type, and perceived risk.
What Is Gross Rent Multiplier in Real Estate?
A plain-English definition
GRM answers a simple question:
How large is the property’s price compared with the gross annual rent it produces?
If a property costs $800,000 and generates $100,000 in annual gross rent, its GRM is 8.
In practical terms, investors use the multiplier to put properties with different prices and rent levels on a common screening basis.
For example:
| Property | Price | Annual Gross Rent | GRM |
| A | $500,000 | $50,000 | 10.0 |
| B | $600,000 | $75,000 | 8.0 |
| C | $720,000 | $90,000 | 8.0 |
Properties B and C have the same GRM even though their prices and rental income are different.
What GRM measures
GRM measures the relationship between:
- Property price or market value
- Gross annual rental income
It can help investors identify properties that appear inexpensive or expensive relative to their gross rent.
What GRM does not measure
GRM does not directly measure:
- Net operating income (NOI)
- Cash flow
- Cash-on-cash return
- Debt service coverage ratio (DSCR)
- Mortgage payments
- Operating expense efficiency
- Capital expenditures
- Property appreciation
- Tax benefits
- Actual investor profit
That distinction matters because gross rent is revenue, not profit.
The IRS separately recognizes numerous rental-property expenses, including maintenance, insurance, taxes, utilities, management fees, repairs, mortgage interest, and depreciation, depending on the applicable circumstances.
Why investors use GRM first
GRM is attractive because it requires only two core inputs and can be calculated very quickly.
An investor screening dozens of listings may not want to build a detailed underwriting model for every property. GRM can help narrow the list before spending time reviewing leases, expenses, financing, inspections, and due diligence.
Gross Rent Multiplier Formula
The standard formula is:
GRM=Property Price or Market ValueAnnual Gross Rent\boxed{\text{GRM}=\frac{\text{Property Price or Market Value}}{\text{Annual Gross Rent}}}
Formula variables
| Variable | Meaning |
| Property Price | Asking price, purchase price, or another clearly defined value |
| Market Value | The value being used for the comparison |
| Annual Gross Rent | Gross rental income for one year |
| GRM | The resulting price-to-gross-rent multiple |
Example
A duplex is priced at $450,000 and has annual scheduled rent of $54,000.
GRM=$450,000$54,000=8.33\text{GRM}=\frac{\$450,000}{\$54,000}=8.33
The GRM is 8.33.
Estimate property value using GRM
You can rearrange the formula:
Estimated Property Value=Annual Gross Rent×Market GRM\boxed{\text{Estimated Property Value}=\text{Annual Gross Rent}\times\text{Market GRM}}
Suppose a property generates $72,000 in verified annual gross rent and comparable properties indicate a market GRM of 7.5.
$72,000×7.5=$540,000\$72,000\times7.5=\$540,000
The preliminary GRM-based value is $540,000.
This is a screening estimate, not an appraisal.
Calculate required rent
You can also determine how much annual rent would be required to support a particular price at a target GRM:
Required Annual Gross Rent=Property PriceTarget GRM\boxed{\text{Required Annual Gross Rent}=\frac{\text{Property Price}}{\text{Target GRM}}}
A property priced at $750,000 with a target GRM of 7.5 would require:
$750,0007.5=$100,000\frac{\$750,000}{7.5}=\$100,000
So the property would need $100,000 in annual gross rent, or:
$100,00012=$8,333\frac{\$100,000}{12}=\$8,333
about $8,333 per month in gross rent.
Annual GRM vs. monthly GRM
The standard convention is usually annual gross rent.
For example:
$600,000$60,000=10\frac{\$600,000}{\$60,000}=10
Using monthly rent instead:
$600,000$5,000=120\frac{\$600,000}{\$5,000}=120
The second calculation produces a monthly GRM of 120, which is mathematically equivalent to an annual GRM of 10 because:
120÷12=10120\div12=10
The important rule is to use the same convention when comparing properties. A property calculated using annual GRM should not be compared with a property using monthly GRM without converting the figures.
How to Calculate Gross Rent Multiplier Step by Step
Step 1: Confirm the property price
For a listing screen, you might start with the asking price.
For an acquisition analysis, you could use your expected purchase price.
You can also calculate an investor-defined GRM using an all-in acquisition basis that includes specified acquisition or initial renovation costs, but that is a different convention from the standard price-to-rent calculation.
The key is consistency.
Do not calculate one property using asking price and another using an all-in basis and then treat the resulting multipliers as directly comparable.
Step 2: Determine annual gross rent
Start with the monthly rent for the property.
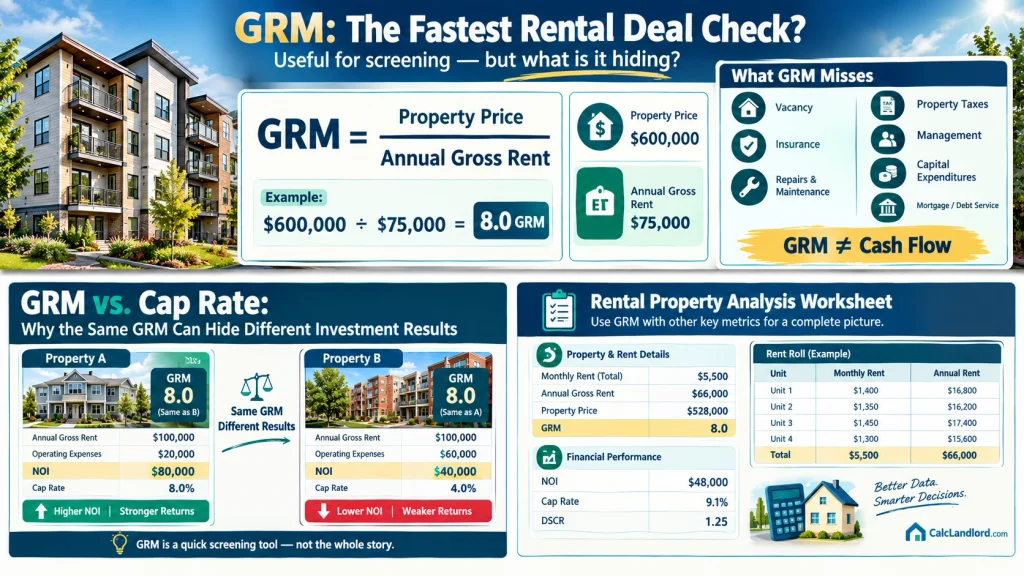
Suppose a four-unit property has:
| Unit | Monthly Rent |
| Unit 1 | $1,400 |
| Unit 2 | $1,350 |
| Unit 3 | $1,450 |
| Unit 4 | $1,300 |
| Total | $5,500 |
Annual scheduled rent:
$5,500×12=$66,000\$5,500\times12=\$66,000
The annual gross scheduled rent is $66,000.
Step 3: Divide price by annual rent
If the property is listed for $528,000:
GRM=$528,000$66,000=8.0\text{GRM}=\frac{\$528,000}{\$66,000}=8.0
GRM = 8.0.
Step 4: Check what the rent number actually represents
This is where experienced underwriting differs from a simple calculator exercise.
Ask whether the $66,000 represents:
- Current contracted in-place rent
- Advertised market rent
- Potential rent after renovations
- Rent actually collected
- Rent before concessions
- Rent after concessions
- Rent plus parking or storage
- Rent plus utility reimbursements
- Rent plus other recurring income
Do not silently mix these definitions.
For a quick screen, scheduled gross rent may be appropriate. For an acquisition decision, verify the underlying income.
The IRS notes that rental income can include amounts received for the use or occupation of property and can include certain payments beyond ordinary monthly rent.
Gross Rent Multiplier Examples
Example 1: Single-family rental
Suppose a single-family rental sells for $360,000 and rents for $2,500 per month.
Annual gross rent:
$2,500×12=$30,000\$2,500\times12=\$30,000
GRM:
$360,000$30,000=12\frac{\$360,000}{\$30,000}=12
GRM = 12.0
The ratio tells you the relationship between the property’s price and its gross annual rent. It does not tell you the property’s actual cash flow.
Example 2: Duplex
A duplex sells for $420,000.
Each unit rents for $1,900 per month.
Total monthly rent:
$1,900+$1,900=$3,800\$1,900+\$1,900=\$3,800
Annual gross rent:
$3,800×12=$45,600\$3,800\times12=\$45,600
GRM:
$420,000$45,600=9.21\frac{\$420,000}{\$45,600}=9.21
GRM ≈ 9.21
Example 3: Four-unit property
Consider a fourplex:
| Metric | Amount |
| Purchase price | $720,000 |
| Monthly gross scheduled rent | $7,500 |
| Annual gross scheduled rent | $90,000 |
| GRM | 8.0 |
$720,000$90,000=8.0\frac{\$720,000}{\$90,000}=8.0
This property has an 8.0 GRM.
Now assume genuinely comparable properties in the same submarket are being traded around 7.5 to 8.5 GRM. The listing may deserve further investigation.
That does not mean it is automatically a bargain.
Example 4: Estimate value from a market GRM
Assume verified comparable transactions suggest a GRM of 7.5.
The subject property’s verified annual gross rent is $90,000.
$90,000×7.5=$675,000\$90,000\times7.5=\$675,000
The preliminary GRM-based value is $675,000.
If the seller wants $720,000, there is a $45,000 difference between the asking price and the GRM-based estimate.
That gap should trigger questions.
Perhaps the property has:
- Better condition
- Newer mechanical systems
- Stronger tenants
- Lower operating expenses
- Better location
- More parking
- Expansion potential
- Above-average amenities
- Genuine additional income potential
Or perhaps the seller’s rent assumptions are too optimistic.
GRM tells you where to investigate. It does not tell you the final answer.
Example 5: Two properties with the same GRM
Consider two properties, each priced at $1 million and producing $125,000 in gross annual rent.
Both have:
$1,000,000$125,000=8.0\frac{\$1,000,000}{\$125,000}=8.0
So both have a GRM of 8.0.
But suppose their expenses look like this:
| Metric | Property A | Property B |
| Gross annual rent | $125,000 | $125,000 |
| Operating expenses | $42,000 | $77,000 |
| NOI | $83,000 | $48,000 |
| GRM | 8.0 | 8.0 |
| Cap rate | 8.3% | 4.8% |
The GRM makes the properties look identical.
The operating statements tell a completely different story.
This is one of the most important lessons about GRM: two properties can have the same multiplier while having dramatically different economics.
How to Use GRM in Rental Property Analysis
Screen listings quickly
GRM is particularly useful at the beginning of a deal funnel.
You can calculate it for multiple listings and identify properties that warrant closer examination.
This is much faster than fully underwriting every property you see.
Compare similar properties
GRM can help compare:
- Duplexes with duplexes
- Fourplexes with fourplexes
- Similar multifamily buildings
- Similar neighborhoods
- Similar rent profiles
The more comparable the properties, the more useful the comparison becomes.
Estimate a preliminary value range
Suppose similar properties show GRMs between 7.0 and 8.0.
A property producing $100,000 in annual gross rent would have a rough GRM-based range of:
$100,000×7=$700,000\$100,000\times7=\$700,000
to:
$100,000×8=$800,000\$100,000\times8=\$800,000
That gives you a preliminary market-income range to investigate further.
Set a preliminary maximum offer
Suppose comparable properties support a GRM of 7.5 and a subject property generates $80,000 in verified annual gross rent.
$80,000×7.5=$600,000\$80,000\times7.5=\$600,000
You might use $600,000 as a preliminary screening ceiling, then adjust the analysis based on property condition, expenses, financing, market conditions, and other valuation evidence.
It is not a final offer formula.
Identify possible under-rented properties
Suppose a property is currently collecting $72,000 per year, but verified market evidence indicates it could eventually generate $84,000.
You can calculate two different views:
In-place GRM
Price$72,000\frac{\text{Price}}{\$72,000}
Stabilized GRM
Price$84,000\frac{\text{Price}}{\$84,000}
The stabilized calculation may look better, but you must account for the cost, vacancy, timing, lease restrictions, and execution risk required to achieve the higher rent.
Do not treat future rent as current income.
Use GRM alongside a rental property calculator
A GRM calculator is useful for testing price and rent scenarios quickly.
Useful inputs can include:
- Property price
- Monthly gross rent
- Annual gross rent
- Current GRM
- Target GRM
- Implied property value
- Required gross rent
The calculator handles the arithmetic. Your underwriting still needs to determine whether the assumptions are realistic.
What Is a Good Gross Rent Multiplier?
There is no universal good GRM.
J.P. Morgan similarly notes that appropriate GRM levels vary by market, property type, and perceived risk.
A GRM of 6 might be normal in one market and unusual in another. A GRM of 11 could be reasonable for one property and unattractive for another.
Instead of asking:
“Is a GRM of 8 good?”
ask:
“How does this GRM compare with genuinely similar properties in this market, and why?”
Factors that influence GRM
Local GRMs can be influenced by:
- Property type
- Neighborhood
- Supply and demand
- Property condition
- Building age
- Tenant profile
- Vacancy exposure
- Rent growth potential
- Local regulations
- Rent-control status
- Property taxes
- Insurance costs
- Utility responsibility
- Capital needs
- Perceived investment risk
- Liquidity and resale considerations
How to build a local GRM benchmark
A practical approach is to gather recent sales of similar properties and calculate:
Comparable GRM=Sale PriceComparable Annual Gross Rent\text{Comparable GRM}= \frac{\text{Sale Price}}{\text{Comparable Annual Gross Rent}}
Do not simply average every rental property in a city.
Try to match:
- Asset class
- Unit count
- Submarket
- Condition
- Vintage
- Rent level
- Tenant profile
- Utility responsibility
- Income quality
- Regulatory environment
The goal is a relevant comparable set, not a large but inconsistent dataset.
Why a low GRM can sometimes signal risk
A low multiplier can reflect attractive pricing.
It can also reflect problems.
For example, a property may have a low GRM because it has:
- Significant deferred maintenance
- High property taxes
- Expensive insurance
- Weak tenant demand
- Poor collections
- Frequent turnover
- Difficult management
- Outdated systems
- Limited financing options
- Weak rent-growth prospects
This is why GRM should create questions, not eliminate them.
GRM vs. Cap Rate
GRM and cap rate both relate property value to income, but they use fundamentally different income measures.
| Metric | Formula | Income Basis | Primary Use |
| GRM | Property Value ÷ Gross Annual Rent | Gross income before operating expenses | Fast screening |
| Cap Rate | NOI ÷ Property Value | Net operating income after operating expenses | Unlevered property analysis |
The cap-rate formula is:
Cap Rate=NOIProperty Value\boxed{\text{Cap Rate}=\frac{\text{NOI}}{\text{Property Value}}}
Why GRM and cap rate can disagree
GRM ignores operating expenses.
Cap rate incorporates NOI.
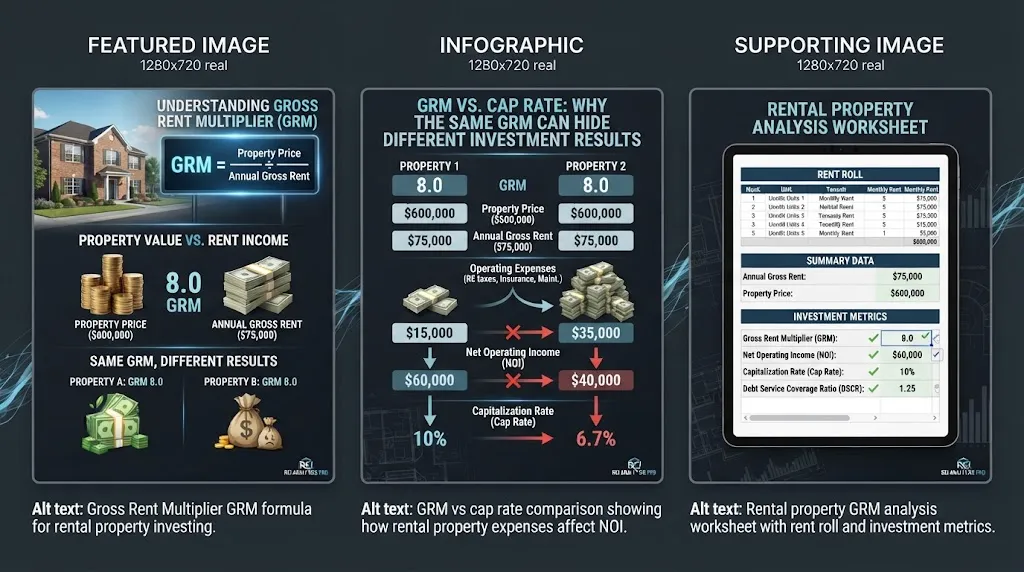
Suppose two properties each cost $1 million and each produce $125,000 in annual gross rent.
Both have an 8.0 GRM.
But if Property A produces $83,000 of NOI and Property B produces only $48,000, their cap rates are:
Property A:
$83,000$1,000,000=8.3%\frac{\$83,000}{\$1,000,000}=8.3\%
Property B:
$48,000$1,000,000=4.8%\frac{\$48,000}{\$1,000,000}=4.8\%
The difference comes from their expense structures.
Why lower GRM and higher cap rate point in different directions
A lower GRM means a lower price relative to gross rent.
A higher cap rate means more NOI relative to property value.
Those are related concepts, but they are not interchangeable.
A property can have a lower GRM and still have a lower cap rate because its expenses consume much more of its gross income.
When cap rate becomes more useful
Once a property passes the initial GRM screen, cap-rate analysis becomes more useful because it forces you to examine the operating economics.
You need to understand:
- Effective gross income
- Vacancy and collection loss
- Property taxes
- Insurance
- Repairs
- Maintenance
- Management
- Utilities
- Other operating expenses
Then calculate NOI.
Stessa likewise distinguishes GRM from cap rate because cap rate uses NOI rather than gross rental income.
GRM vs. Cash Flow, Cash-on-Cash Return, and DSCR
So GRM is only one piece of the rental-property analysis.
GRM vs. cash flow
GRM asks:
How does property price compare with gross rent?
Cash flow asks:
How much money remains after the property’s actual expenses and financing obligations?
A property can have an attractive GRM but poor cash flow if:
- Expenses are high
- Vacancy is high
- Debt service is expensive
- Repairs are frequent
- Capital reserves are substantial
GRM vs. cash-on-cash return
Cash-on-cash return measures annual pre-tax cash flow relative to the cash invested.
Cash-on-Cash Return=Annual Pre-Tax Cash FlowTotal Cash Invested\boxed{\text{Cash-on-Cash Return}= \frac{\text{Annual Pre-Tax Cash Flow}} {\text{Total Cash Invested}}}
Unlike GRM, cash-on-cash return considers the investor’s equity and financing structure.
That makes it useful when comparing different down-payment or financing scenarios.
GRM vs. DSCR
Debt service coverage ratio measures how well a property’s NOI covers its annual debt service:
DSCR=NOIAnnual Debt Service\boxed{\text{DSCR}= \frac{\text{NOI}}{\text{Annual Debt Service}}}
GRM says nothing about whether the property can support its mortgage.
A property might have a low GRM while still producing insufficient NOI to satisfy a lender’s underwriting requirements.
The correct order for analyzing a deal
A practical workflow is:
- GRM: Screen the listing.
- Income verification: Confirm leases, rent roll, collections, and financial records.
- Vacancy analysis: Account for vacancy, concessions, delinquency, and bad debt.
- Expense underwriting: Build a realistic operating budget.
- NOI: Calculate net operating income.
- Cap rate: Compare NOI with property value.
- Capital needs: Estimate repairs, replacements, and reserves.
- Financing: Model loan terms and debt service.
- DSCR: Test debt-service coverage.
- Cash flow and returns: Calculate cash flow and cash-on-cash return.
- Stress test: Model weaker rents, higher vacancy, higher expenses, and slower stabilization.
This sequence prevents a simple GRM calculation from becoming the entire investment thesis.
Gross Rent Multiplier Limitations
The simplicity of GRM is also its greatest weakness.
GRM ignores operating expenses
GRM does not subtract:
- Property taxes
- Insurance
- Repairs
- Maintenance
- Management fees
- Owner-paid utilities
- Advertising
- Leasing costs
- Administrative costs
- Other operating expenses
Two properties with the same gross rent can therefore produce very different NOI.
GRM can hide vacancy and collection problems
Scheduled rent is not necessarily collected rent.
Consider a property that could theoretically generate $100,000 in annual rent but has significant vacancies and delinquency.
The headline GRM might look attractive when calculated from scheduled rent.
The actual income available to the owner can be materially lower.
The IRS distinguishes rental income from expenses and notes that, for cash-basis taxpayers, uncollected rent generally is not reported as rental income simply because it was expected.
GRM ignores capital expenditures
A building may have a great-looking GRM and still require substantial investment.
Potential capital needs include:
- Roof replacement
- HVAC systems
- Plumbing
- Electrical work
- Exterior rehabilitation
- Foundation work
- Parking improvements
- Appliances
- Major unit renovations
- Code-related improvements
An older property with significant deferred maintenance may need a lower purchase price even if its gross rent looks strong.
GRM ignores financing
GRM does not include:
- Interest rate
- Loan-to-value ratio
- Amortization period
- Loan fees
- Debt service
- Balloon risk
- Refinancing assumptions
Those factors can materially change investor-level cash flow.
GRM is not a real payback period
A GRM of 8 does not mean:
“The property will pay for itself in eight years.”
That interpretation is misleading.
Gross rent is revenue.
The investor still has operating expenses, vacancy, repairs, capital requirements, financing costs, taxes, and other obligations.
GRM is a price-to-gross-income ratio, not an actual investment payback calculation.
Some financial education sources use payback language when describing GRM, but the underlying calculation itself does not subtract the costs required to determine an investor’s true payback period.
GRM does not measure tax benefits
GRM does not calculate depreciation, deductible expenses, taxable income, or after-tax returns.
Those questions belong in a separate tax analysis. The IRS explains that rental income and expenses, depreciation, and related reporting requirements are separate parts of rental-property taxation.
How to Verify the Numbers Before Relying on GRM
A GRM is only as reliable as the numbers used to calculate it.
Verify the price
Confirm:
- Current asking price
- Expected negotiated purchase price
- Known acquisition costs
- Immediate renovation requirements
- Safety-related work
- Whether the property is turnkey or needs substantial rehabilitation
Use a clearly defined price basis throughout the analysis.
Verify the rent roll
Request the current rent roll and compare it with the underlying leases.
Look for:
- Unit-by-unit rent
- Lease expiration dates
- Renewal terms
- Concessions
- Delinquent balances
- Vacant units
- Deposits
- Recent rent changes
A seller’s summary can be useful, but the underlying documentation is more important.
Compare in-place rent with market rent
These are different numbers.
In-place rent is what existing leases actually require.
Market rent is what comparable units may command under current market conditions.
A property can have below-market rents and legitimate upside.
But that upside has to be underwritten.
Ask:
- How much rent increase is realistic?
- When can leases legally be changed?
- What renovation is required?
- How much downtime is expected?
- What will the renovation cost?
- Are tenants likely to accept the new rent?
- Are there local restrictions?
Review trailing-12-month records
A trailing-12-month, or T-12, operating statement can help show what actually happened over the previous year.
Compare reported figures with:
- Rent collections
- Bank deposits
- Leases
- Rent roll
- Utility bills
- Tax bills
- Insurance invoices
- Repair records
The purpose is to distinguish actual operating performance from projections.
Separate recurring and non-recurring income
Do not automatically treat every income line as recurring rent.
Separate:
- Base rent
- Parking
- Storage
- Laundry
- Pet-related charges
- Utility reimbursements
- Late fees
- Application fees
- One-time payments
- Other recurring income
Your chosen GRM convention should be clearly stated before comparing one property with another.
Inspect the physical property
Financial statements cannot reveal every problem.
Look for evidence of:
- Deferred maintenance
- Aging HVAC
- Roof deterioration
- Plumbing issues
- Electrical deficiencies
- Water intrusion
- Exterior problems
- Deferred unit turns
- Parking deterioration
A low GRM can sometimes be explained by physical problems that will require substantial future spending.
Build the benchmark from comparable properties
A local GRM benchmark should ideally use recent transactions involving properties that resemble the subject property.
Consider:
| Comparable Factor | Why It Matters |
| Location | Rent and value can vary significantly by submarket |
| Asset type | Duplex economics differ from larger multifamily |
| Unit count | Scale affects operations and income |
| Condition | Renovated properties may command different pricing |
| Age | Older systems may create higher capital needs |
| Tenant profile | Stability and collection risk can differ |
| Utilities | Owner-paid utilities affect expenses |
| Regulation | Rent restrictions can affect income potential |
| Income quality | Scheduled rent may differ from collected income |
A national “good GRM” number is usually much less useful than a well-constructed local comparable set.
GRM vs. Gross Income Multiplier (GIM)
Gross Rent Multiplier (GRM) and Gross Income Multiplier (GIM) are closely related terms, but they should not automatically be treated as identical.
A basic GRM commonly uses gross rental income:
GRM=Property PriceGross Rental Income\text{GRM}= \frac{\text{Property Price}} {\text{Gross Rental Income}}
A GIM may use a broader gross-income measure that includes additional recurring income.
For example:
| Income Source | GRM Convention | Broader GIM Convention |
| Base rent | Usually included | Included |
| Parking income | Depends on convention | May be included |
| Storage income | Depends on convention | May be included |
| Laundry income | Depends on convention | May be included |
| Utility reimbursements | Depends on convention | May be included |
| Other recurring income | Depends on convention | May be included |
Wall Street Prep notes that GRM and GIM are sometimes used interchangeably, while also distinguishing gross rental income from broader gross-income measures.
Why the distinction matters
Imagine two analysts calculate a multiplier for the same property.
Analyst A uses:
Base rent only
Analyst B uses:
Base rent + parking + storage + recurring reimbursements
They can produce different multipliers from the same property.
Neither calculation is automatically wrong if the convention is clearly defined.
The mistake is comparing the two numbers as though they use identical income definitions.
Before using a market multiplier, determine exactly what income was used to derive it.
GRM Mistakes Investors Should Avoid
Comparing unlike properties
Do not compare a newly renovated urban fourplex with an aging rural duplex simply because both are rentals.
Different property types and risk profiles can support very different GRMs.
Using advertised rent as actual income
An online listing may advertise what a unit could rent for.
That is not the same as:
- Current contracted rent
- Actual collections
- Stabilized rent
Verify the number.
Treating future rent as current rent
A property projected to reach $100,000 of annual rent does not currently produce $100,000 if existing leases generate only $80,000.
Show both:
- In-place GRM
- Stabilized GRM
Then show the cost and risk required to reach stabilization.
Assuming GRM is a payback period
An 8.0 GRM does not mean an eight-year investor payback.
Rent is revenue, not profit.
Ignoring property-tax changes
Historical property taxes may not equal future ownership costs.
Local reassessment rules can affect the buyer’s future tax burden, so investigate the applicable jurisdiction rather than simply copying the seller’s tax bill.
Ignoring owner-paid utilities
Two otherwise similar properties can have very different expenses if one owner pays:
- Water
- Sewer
- Gas
- Electricity
- Trash
- Common-area utilities
That difference can materially affect NOI and cash flow even when GRM is identical.
Buying based on GRM alone
GRM should be the beginning of the analysis.
A serious deal review should progress to:
Practical GRM Deal-Screening Checklist
Use this checklist before allowing GRM to influence a purchase decision.
Price
- Confirm the current asking price.
- Estimate the realistic acquisition price.
- Identify known acquisition costs.
- Identify immediate renovation or safety work.
- Keep the price basis consistent with comparable properties.
Gross rent
- Obtain the current rent roll.
- Review the leases and amendments.
- Verify lease concessions.
- Review collections where available.
- Identify vacant units.
- Review delinquency and bad debt.
- Separate base rent from other income.
- Compare in-place rent with verified market rent.
- Calculate in-place and stabilized scenarios separately.
Property condition
- Review maintenance history.
- Investigate deferred maintenance.
- Estimate major capital expenditures.
- Review roof and HVAC condition.
- Check plumbing and electrical systems.
- Account for expected unit-turn costs.
Operating performance
- Review trailing-12-month statements.
- Estimate property taxes.
- Obtain insurance estimates.
- Estimate management costs.
- Include owner-paid utilities.
- Model realistic repairs and maintenance.
- Account for vacancy and collection loss.
Investment analysis
- Calculate GRM.
- Compare it with relevant local comparables.
- Calculate NOI.
- Calculate cap rate.
- Estimate debt service.
- Test DSCR.
- Calculate projected cash flow.
- Calculate cash-on-cash return.
- Stress-test rent, vacancy, expenses, and financing.
- Validate the deal using more than one valuation method.
The final decision should come from the full underwriting, not from the GRM alone.
More to Explore https://calclandlord.com/commercial-real-estate-due-diligence-checklist-template/
People Also Ask About GRM
No.
A lower GRM means the property has more gross rent relative to its price, assuming the same income convention is used. But a low GRM can also reflect high expenses, deferred maintenance, weak demand, collection problems, or other risks.
Compare the property with genuinely similar investments and examine the entire operating statement.
No.
Standard GRM uses gross rental income before deducting operating expenses.
That is the primary difference between GRM and cap rate.
It depends on the income convention used.
A standard GRM often uses scheduled or potential gross rent, meaning vacancy and collection losses are not separately deducted from the basic calculation.
For acquisition underwriting, vacancy and credit loss should be modeled separately.
GRM compares property value with gross rent:
GRM=Property ValueGross Annual Rent\text{GRM}= \frac{\text{Property Value}} {\text{Gross Annual Rent}}
Cap rate compares NOI with property value:
Cap Rate=NOIProperty Value\text{Cap Rate}= \frac{\text{NOI}} {\text{Property Value}}
GRM is faster. Cap rate requires a more detailed expense analysis.
You can use: Yes, as a preliminary valuation method.
Estimated Value=Annual Gross Rent×Comparable GRM\text{Estimated Value} = \text{Annual Gross Rent} \times \text{Comparable GRM}
But the result should be validated with other evidence, including comparable sales, NOI, cap rate, property condition, local market factors, and expected capital needs.
Is GRM the same as Gross Income Multiplier?
Not necessarily.
The terminology varies. GRM commonly emphasizes gross rental income, while GIM can use a broader gross-income figure that includes additional recurring income.
Always determine the exact income definition before comparing multipliers.
What does an 8 GRM mean?
An 8 GRM means the property’s price or market value is eight times the annual gross rental-income figure used in the calculation.
For example:
$640,000÷$80,000=8\$640,000\div\$80,000=8
It does not mean the property will pay for itself in eight years.
How can investors use GRM to compare two properties?
Calculate the GRM for both using the same income definition and price convention.
Then compare the properties:
- Operating expenses
- NOI
- Cap rates
- Vacancy
- Capital needs
- Financing
- DSCR
- Cash flow
- Market and property risks
The GRM is the starting comparison, not the final one.
How can I calculate GRM quickly?
Use:
GRM=Property PriceAnnual Gross Rent\boxed{\text{GRM}= \frac{\text{Property Price}} {\text{Annual Gross Rent}}}
For monthly rent, multiply the monthly amount by 12 first.
A calculator can make scenario testing easier when you want to compare multiple purchase prices, rent levels, or market GRM assumptions.
Should I use asking price or purchase price?
For screening, asking price is often the most immediately available figure.
For acquisition analysis, your expected purchase price may be more relevant.
The important part is to define the price basis clearly and use a consistent convention when comparing properties.
Bottom Line
The Gross Rent Multiplier (GRM) is valuable because it is fast.
GRM=Property PriceAnnual Gross Rent\boxed{\text{GRM}= \frac{\text{Property Price}} {\text{Annual Gross Rent}}}
Use it to screen listings, compare genuinely comparable rental properties, estimate a preliminary value range, and identify deals that deserve deeper investigation.
Then go beyond the multiplier.
Verify the rent roll. Check actual collections. Review the trailing-12-month financials. Model vacancy and expenses. Calculate NOI and cap rate. Estimate capital needs. Test financing and DSCR. Calculate cash flow and cash-on-cash return. Finally, stress-test the assumptions.
That is how GRM becomes useful in real-world rental-property investing: not as the final answer, but as the first checkpoint in a much larger underwriting process.

Pingback: DSCR Formula: 2 Ways to Calculate It for Rentals
Pingback: Break-Even Occupancy Rate: 5 Critical Rental Insights