
Cash-on-Cash Return Explained: Formula, Example, and 2026 Benchmarks
If you’ve ever compared two rental properties and couldn’t tell which one actually made more sense for your money, cash-on-cash return is the number that settles the argument. It measures how much annual cash flow you earn for every dollar you personally put into a deal — not the purchase price, not the property’s total value, just your actual out-of-pocket cash. In this guide, you’ll get the exact formula, a full worked example, benchmark ranges by investment strategy, and a clear framework for knowing when CoC should — and shouldn’t — drive your decision.
Quick answer: Cash-on-Cash Return = annual pre-tax cash flow ÷ total cash invested, expressed as a percentage. A CoC between 8–12% is a common target for long-term rentals in cash-flow markets, though the right number depends heavily on your strategy and market.
What Is Cash-on-Cash Return? (Definition & Why It Matters to Landlords)
Cash-on-cash return tells you how many dollars of annual cash flow you earn for every dollar of cash you actually put into a deal. Unlike metrics based on the purchase price, it’s built entirely around the cash that leaves your bank account at closing and the cash that comes back to you each year afterward.
For landlords, this distinction matters because two identical-looking properties can produce very different CoC numbers depending on how they’re financed. A property bought with a small down payment and financed with a DSCR loan can post a much higher (or lower) cash-on-cash return than the same property bought in cash — even though the property itself hasn’t changed. That’s what makes CoC uniquely useful for leveraged buy-and-hold investors: it isolates the return on your capital, not the asset’s.
It’s important to be clear about what CoC is not: it’s a one-year snapshot, not a full-life return. It doesn’t account for appreciation, principal paydown, or tax benefits — which is why later in this guide we compare it directly against ROI and IRR.
The Cash-on-Cash Return Formula (Exact Inputs Explained)
The formula itself is simple. Getting the inputs right is where most landlords go wrong.
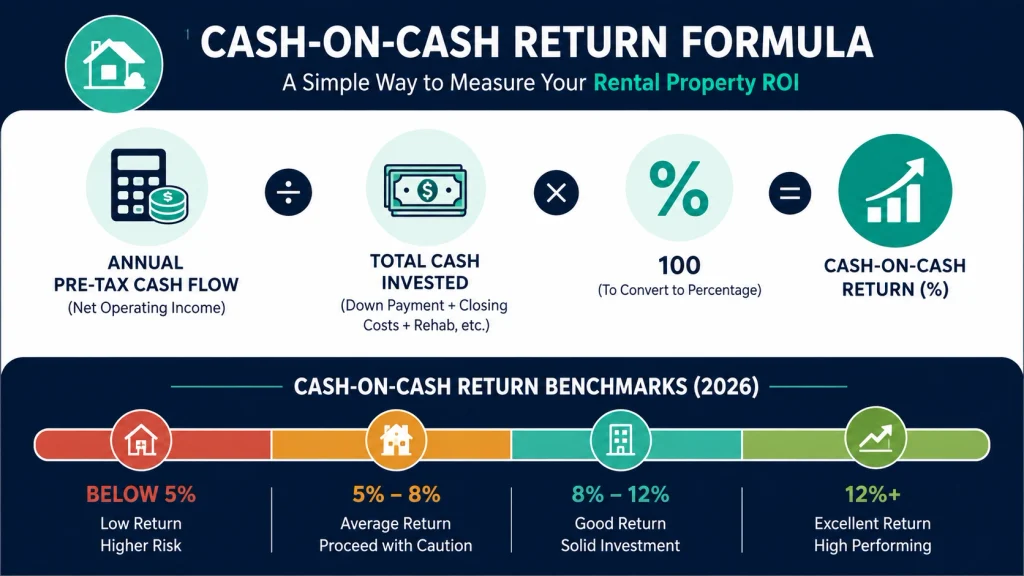
Cash-on-Cash Return = (Annual Pre-Tax Cash Flow ÷ Total Cash Invested) × 100
Numerator: Annual Pre-Tax Cash Flow
Start with gross rental income, then subtract:
- Vacancy and concessions
- Operating expenses (property taxes, insurance, management fees, maintenance, utilities, HOA dues)
- Annual debt service (principal + interest)
What’s left is your annual pre-tax cash flow.
Denominator: Total Cash Invested
This should include every dollar of out-of-pocket cash, not just the down payment:
- Down payment
- Closing costs (title, recording, lender fees, appraisal, inspection)
- Immediate repairs or rehab needed to make the unit rent-ready
- Optional but recommended: initial reserves and lease-up costs
The #1 mistake: using only the down payment as “cash invested” and ignoring closing costs and repairs. This artificially inflates CoC and can make a mediocre deal look excellent on paper.
How to Calculate Cash-on-Cash Return: Step-by-Step Example
Let’s walk through a realistic 2026 example on a single-family rental.
Deal setup:
- Purchase price: $300,000
- Down payment: 20% ($60,000)
- Loan: $240,000 at 7% interest, 30-year term
- Expected rent: $2,400/month ($28,800/year)
- Vacancy allowance: 5%
- Operating expenses: 35% of effective rent (taxes, insurance, management, maintenance)
- Closing costs: 3% of purchase price ($9,000)
- Initial repair budget: $3,000
Step 1 — Total Cash Invested $60,000 (down payment) + $9,000 (closing costs) + $3,000 (repairs) = $72,000
Step 2 — Annual Pre-Tax Cash Flow
- Gross annual rent: $28,800
- Less 5% vacancy: −$1,440 → Effective rent: $27,360
- Less 35% operating expenses: −$9,576 → NOI: $17,784
- Less annual debt service (≈$19,150 at 7%/30-yr on $240,000): −$19,150
- Annual cash flow: −$1,366
3 — Apply the Formula −$1,366 ÷ $72,000 × 100 = −1.9% cash-on-cash return
This example is intentionally realistic for a higher-rate environment: at 7% interest, a fairly typical single-family rental can post a slightly negative CoC even with reasonable assumptions. That’s a useful reality check before we get to benchmarks — a negative number here doesn’t automatically mean the deal is bad, and it doesn’t automatically mean the seller’s numbers are wrong either. It means the deal needs to be evaluated with total return in mind, not CoC alone (more on that in the “Negative CoC” section below).
What Counts as Total Cash Invested (The Mistake Most Calculators Get Wrong)
Beyond the down payment, three categories are consistently left out of amateur calculations:
- Closing costs. On a $300,000 property, 2–4% in closing costs is $6,000–$12,000 — often larger than people expect.
- Rent-ready repairs. Paint, flooring, appliance fixes, and code-compliance items needed before a tenant can move in are cash invested, not a “later” expense.
- Reserves and lease-up costs. Not every investor includes these, but if you’re setting aside cash specifically to fund the deal’s first few months, it’s honest to count it.
Leaving these out doesn’t make the deal better — it just makes the number wrong. A CoC calculated on the down payment alone might read 9% when the true, fully-loaded number is closer to 6%.
Annual Pre-Tax Cash Flow: What Goes In and What Gets Left Out
The cash flow side has its own common blind spots:
- Use effective rent, not gross rent. A 5% vacancy allowance on a $28,800 gross rent isn’t a rounding error — it’s $1,440 a year.
- Include CapEx reserves even if you don’t fund a literal account. Roofs, HVAC systems, and water heaters don’t fail on a schedule that’s convenient for your cash flow projection.
- Use investor-rate debt service, not owner-occupied rates. Investment property loans typically carry higher rates and stricter terms than an owner-occupied mortgage, and using the wrong rate will overstate cash flow.
- Verify seller-provided expense numbers. A seller’s tax bill often resets after a sale (reassessment), and their insurance may not reflect current landlord-policy pricing.
What Is a Good Cash-on-Cash Return in 2026? (Benchmarks by Strategy)
There’s no single “good” number — the right target depends on your strategy and market:
| CoC Range | What It Typically Means |
| Below 5% | Usually only justifiable in high-appreciation, low-cash-flow markets, or a clear value-add plan |
| 5–8% | Common in expensive coastal/tech-hub markets where appreciation is the main driver, not cash flow |
| 8–12% | Core target for most long-term rental investors in cash-flow-focused markets |
| 12–15%+ | Often value-add, BRRRR, or higher-risk strategies that warrant deeper due diligence |
Short-term rentals (STR) are a special case. STR properties can post higher headline CoC than long-term rentals, but that number comes with more volatility, more active management, and more regulatory risk (many cities have tightened short-term rental rules). Treat a high STR CoC as a starting point for deeper diligence, not a finish line.
Cash-on-Cash Return vs. Cap Rate vs. ROI vs. IRR (Decision Framework)
These four metrics answer different questions, and the biggest mistake landlords make is treating them as interchangeable.
| Metric | What It Measures | Best Use Case | Main Limitation |
| Cap Rate | Property income relative to price, independent of financing | Initial screening / comparing properties on an apples-to-apples basis | Ignores your actual financing terms |
| Cash-on-Cash Return | Cash yield on your actual cash invested, after debt service | Leveraged buy-and-hold and BRRRR deals | One-year snapshot; ignores appreciation and paydown |
| ROI (Total Return) | Cash flow + appreciation + principal paydown + tax benefits | Understanding the full picture of a hold | Harder to project accurately; more assumptions |
| IRR | Time-weighted return including eventual sale proceeds | Multi-year hold-period analysis, syndications | Requires projecting a future sale price and timeline |
Simple rule of thumb: Use cap rate to screen a list of properties, cash-on-cash return to check whether your specific financing makes a deal work, and total return or IRR to decide whether a lower-CoC deal still fits your longer-term strategy.
How Down Payment and Leverage Change Your Cash-on-Cash Return
Using the same $300,000 property and rent assumptions from the earlier example, here’s how down payment size alone shifts the outcome (at a fixed 7% rate):
| Down Payment | Loan Amount | Approx. Annual Debt Service | Cash Invested* | Cash-on-Cash Return |
| All cash | $0 | $0 | $312,000 | ≈ 5.7% |
| 25% | $225,000 | ~$17,970 | $87,000 | ≈ -0.2% |
| 20% | $240,000 | ~$19,150 | $72,000 | ≈ -1.9% |
| 10% | $270,000 | ~$21,540 | $42,000 | ≈ -9.9% |
*Cash invested includes closing costs and repairs from the earlier example.
This is the concept of negative leverage: when the cost of debt is higher than the property’s unlevered yield, adding more leverage doesn’t amplify your return — it drags it down further. In a high-rate environment, a smaller down payment isn’t automatically the “better” move for cash-on-cash return, even though it frees up cash for other deals.
How Interest Rates Affect Cash-on-Cash Return (Rate Sensitivity)
Rate changes move CoC more than most landlords expect. On the same $240,000 loan from our example, even a modest rate shift changes annual debt service by roughly $1,500–$2,000 — which is a large swing relative to a cash flow number that was already close to zero.
Because of this sensitivity, it’s worth shopping investment-property loan terms (including DSCR loan options) as carefully as you’d negotiate purchase price. A 0.5–1% difference in rate can be the difference between a positive and negative cash-on-cash return on a tightly-margined deal.
Negative Cash-on-Cash Return: When It’s a Red Flag vs. When It’s Strategic
A negative CoC is not automatically a bad deal — but it does require you to know why it’s negative before moving forward.
It can be acceptable when:
- You’re pursuing a value-add plan that will raise rents and cash flow after renovation or repositioning.
- Appreciation and principal paydown in the target market are strong enough that total return still works, and you have the cash reserves to comfortably cover the shortfall.
It’s a red flag when:
- The negative number comes from unrealistic seller-provided numbers rather than your own verified assumptions.
- You don’t have a clear plan (or reserves) to cover ongoing negative cash flow.
- You’re relying on appreciation in a market where that assumption isn’t well supported.
More Explore: https://calclandlord.com/property-investment-returns/
Cash-on-Cash Return by Rental Strategy (Long-Term, STR, BRRRR, Syndications)
- Long-term rentals: 8–12% is a typical target in cash-flow-focused markets, adjusted down in high-appreciation coastal or tech-hub markets.
- Short-term rentals: Can post higher CoC, but stress-test seasonality, occupancy volatility, and local STR regulations before trusting the number.
- BRRRR: Target 8–12% CoC after the refinance step — the refinance changes both your cash invested (cash pulled back out) and your new debt service, so recalculate CoC post-refi rather than using pre-refi numbers.
- Syndications/funds: Limited partner preferred returns are often quoted in the 6–10% range; in this context, “cash-on-cash” typically refers to annual cash distributions relative to capital contributed, not a property-level calculation you control directly.
Common Mistakes That Inflate Your Cash-on-Cash Return
| Mistake | Fix |
| Excluding closing costs and repairs from cash invested | Include every out-of-pocket dollar, not just the down payment |
| Using gross rent instead of effective rent | Apply a realistic vacancy allowance before calculating cash flow |
| Ignoring CapEx reserves | Budget for major systems even without a literal reserve account |
| Using owner-occupied loan rates | Use actual investor-rate financing terms |
| Trusting seller-provided expenses without verification | Independently verify taxes (post-sale reassessment), insurance, and utility costs |
| Treating one strong year as sustainable | Run at least one downside scenario before trusting the number |
Cash-on-Cash Return Checklist: Underwrite a Deal in 10 Steps
- List all cash outflows: down payment, closing costs, repairs, reserves.
- Calculate gross rent, then apply a realistic vacancy allowance.
- Itemize every operating expense: taxes, insurance, management, maintenance, CapEx.
- Calculate NOI, then subtract annual debt service to get cash flow.
- Confirm your interest rate and loan type match actual investor terms.
- Divide annual cash flow by total cash invested to get CoC.
- Run a downside scenario: rent −10%, vacancy +5%, rate +1%.
- Run a major-repair scenario to test your reserve cushion.
- Compare your CoC to your personal target and local comps — not a generic 8–12% rule.
- Document every assumption so you can revisit it if terms change before closing.
How to Use Cash-on-Cash Return in Your Property Comparison & Decision Process
A simple four-step process turns CoC from a static number into a real decision tool:
- Build a base case using conservative rent, vacancy, expense, and rate assumptions.
- Run downside scenarios (lower rent, higher vacancy, higher rate, one major repair) to see how much cushion the deal really has.
- Compare risk-adjusted alternatives — a higher-CoC deal in a less stable area against a lower-CoC deal in a more stable one.
- Layer in total return (appreciation, principal paydown, tax benefits) before making a final call on a deal with a thin or negative CoC.
Rule of thumb: use cash-on-cash return to screen and stress-test deals, not as the sole yes/no decision. Pair it with cap rate for initial screening and total return or IRR for the longer-term picture.
People Also Ask About Cash-on-Cash Return
No. CoC is a one-year cash yield on your invested cash. ROI (total return) adds appreciation, principal paydown, and tax benefits to give a fuller multi-year picture.
No. It only measures annual cash flow relative to cash invested. Appreciation is captured separately in total return or IRR calculations.
Most long-term rental investors in cash-flow markets target 8–12%, though 5–8% is common in high-appreciation markets, and BRRRR or value-add strategies often target 12%+.
Yes. Leaving them out understates your true cash invested and overstates your return.
Yes, if the shortfall is intentional (value-add plan, strong appreciation market) and you have reserves to cover it. It’s a warning sign if the negative number comes from unverified assumptions or you have no cushion to absorb it.
Cap rate ignores your financing and measures the property’s income relative to its price. Cash-on-cash return factors in your actual loan terms and measures the return on your specific cash investment.
Higher rates increase your annual debt service, which reduces cash flow and lowers CoC — even a 0.5–1% rate change can swing a tightly-margined deal from positive to negative.
Conclusion: Key Takeaways
- Cash-on-cash return = annual pre-tax cash flow ÷ total cash invested — a one-year cash yield on your money, not a full-life return.
- Include every out-of-pocket dollar (down payment, closing costs, repairs) in “cash invested” — this is the most common source of inflated numbers.
- There’s no single “Good” CoC; benchmarks shift by strategy (long-term, STR, BRRRR, syndication) and by market type (cash-flow vs. appreciation-driven).
- Use CoC alongside cap rate, ROI, and IRR — each answers a different question, and no single metric should make your final decision alone.
- Before trusting any CoC number on a deal you’re considering, run it through the [Cash-on-Cash Return Calculator] and stress-test it against a rent, vacancy, and rate downside scenario.
Next step: Plug your own numbers into CalcLandlord’s Cash-on-Cash Return Calculator, then compare the result against the cap rate and total-return figures for the same property before you commit.
This content is for educational and informational purposes only and should not be considered legal, tax, accounting, or financial advice. Loan terms, tax treatment, and regulations vary by state, lender, and individual circumstances. Consult a qualified professional for advice specific to your situation

Pingback: 9 Rental Property Finance Secrets Landlords Fear
Pingback: 7% Rates Are Quietly Wrecking Your Cash-on-Cash Return
Pingback: The Real Cost of Evicting a Tenant (It's Not $250)