
How High Mortgage Interest Rates Affect Investor Cash-on-Cash Returns in 2026
Same house. As same rent. Same tenant. One number changed — and it cut this investor’s return by more than half.
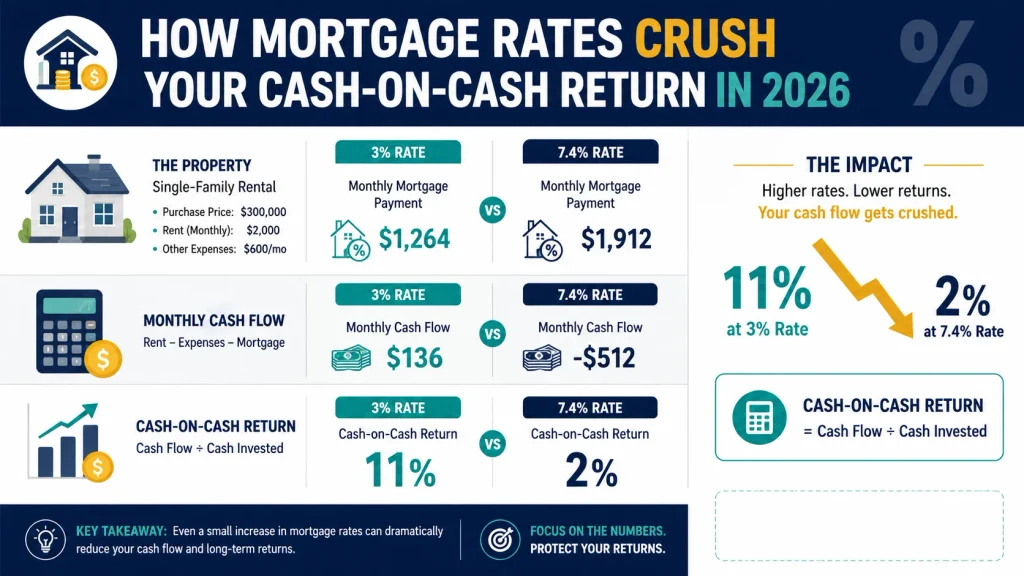
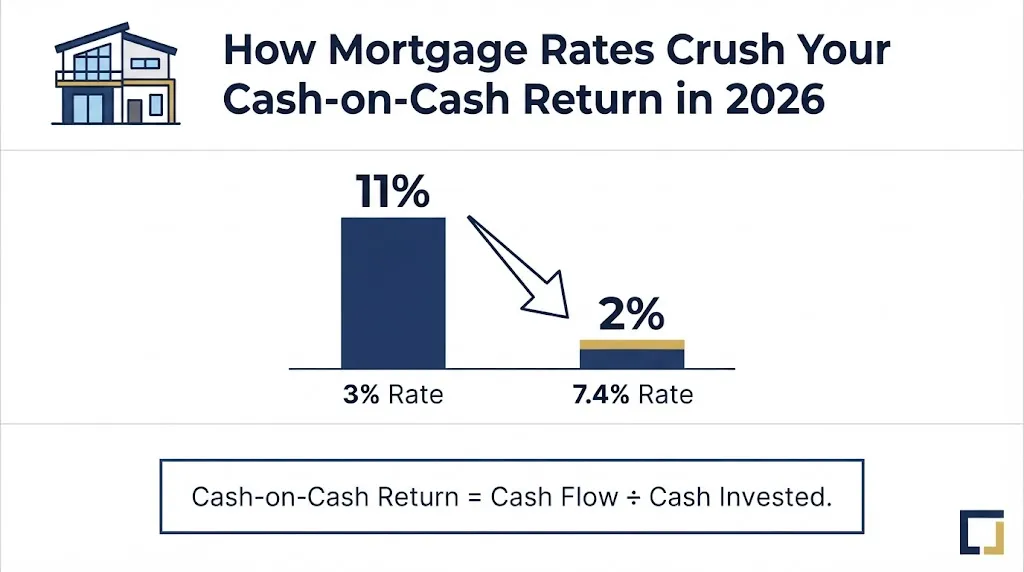
In 2026, a $280,000 rental at a 3% mortgage rate handed its owner roughly an 11% cash-on-cash return. Buy that exact property today at a 7.4% investor rate, and the return drops to around 2%. Nothing about the deal got worse. The mortgage did.
That’s the part most rate coverage skips: rates don’t just make borrowing “more expensive” in the abstract — they eat your cash flow directly, dollar for dollar. Here’s exactly how, with the current numbers.
In September 2026, 30-year fixed mortgage rates are averaging roughly 6.7%–6.8%, and investment property loans typically price 0.5–0.875 percentage points above that — putting most conventional rental-property financing in the 7.2%–7.6% range, with DSCR loans running anywhere from about 6.0% to 8.5% depending on the deal. Because cash-on-cash return is calculated after your mortgage payment, every basis point of rate increase eats directly into the number. On a typical leveraged rental, the difference between a 3% rate and today’s 7%+ rate can cut cash-on-cash return by more than half — sometimes turning a strong deal into one that barely breaks even.
If you’re a landlord or rental-property investor trying to figure out what today’s rates actually mean for your return — not just that “rates are higher” — this guide walks through the math, the current numbers, and what to do about it.
This article is educational information, not financial, tax, or legal advice. Always run your own numbers before making an investment decision.
1. What Is Cash-on-Cash Return (and Why It Matters More When Rates Are High)
Cash-on-cash return measures the cash income a rental property produces relative to the actual cash you put into the deal — your down payment, closing costs, and any upfront repairs. It’s different from cap rate, which looks at a property’s return as if you paid all cash, ignoring financing entirely.
That distinction is exactly why cash-on-cash return is the metric that moves the most when mortgage rates rise. Cap rate is a function of the property and the market. Cash-on-cash return is a function of the property and your loan. When your interest rate goes up, your net operating income (NOI) doesn’t change, but the amount of it left over after the mortgage payment does — and that leftover amount is the entire numerator of the cash-on-cash formula.
For most landlords, cash-on-cash return is also the number that answers the question that actually matters day to day: “Is my down payment working harder than it would sitting in a savings account or money market fund?” In a higher-rate environment, that comparison gets a lot less flattering unless you understand the mechanics below.
2. How High Mortgage Rates Directly Reduce Cash-on-Cash Return: The Formula and Mechanics
The formula is straightforward:
Cash-on-Cash Return = (Annual Pre-Tax Cash Flow ÷ Total Cash Invested) × 100
Where:
- Annual Pre-Tax Cash Flow = Net Operating Income (NOI) − Annual Mortgage Payment (principal + interest, and often taxes/insurance if escrowed)
- Total Cash Invested = Down Payment + Closing Costs + Initial Repairs/Rehab
NOI is set by the property and the market — rent minus operating expenses like taxes, insurance, maintenance, and management. It doesn’t care what your interest rate is. Your annual mortgage payment, on the other hand, is driven almost entirely by three things: loan amount, rate, and term.
Here’s the mechanism in plain terms: a higher rate increases the interest portion of every monthly payment without increasing NOI at all. That extra interest comes straight out of your cash flow, which is the numerator of the formula. Total cash invested (the denominator) generally doesn’t change with the rate. So a rate increase shrinks the top of the fraction while the bottom stays the same — cash-on-cash return falls, sometimes sharply, even though nothing about the property itself has changed.
This is also why cash-on-cash return can decline even when rent is rising: if your rate resets or you buy a new property at today’s rates, the mortgage-payment increase can outpace whatever rent growth you’re seeing.
3. The 2026 Mortgage Rate Environment for Investment Properties
As of the first week of September 2026, Freddie Mac’s Primary Mortgage Market Survey put the average 30-year fixed rate at 6.71%, up slightly from 6.66% the prior week, with the 15-year fixed averaging 6.04%. A year earlier, the 30-year averaged 6.50% — so rates have drifted modestly higher over the past year rather than falling.
Investment property loans carry a premium over that primary-residence rate. Conventional investor loans typically run 0.50 to 0.875 percentage points higher, which puts most investor rates in roughly the 7.2%–7.6% range on a comparable borrower profile. DSCR loans (which qualify you on the property’s rental income rather than your personal income) span a wider band — commonly 6.0% to 8.5%, depending on your DSCR ratio, credit score, and loan-to-value.
On the broader policy backdrop, the Federal Reserve has held its federal funds target range at 3.50%–3.75% since early 2026, with its next scheduled decision on September 15–16, 2026. The Mortgage Bankers Association and Fannie Mae both project 30-year rates staying in roughly the 6.6%–6.8% band through the rest of 2026 and into 2027 — in other words, no forecaster is currently calling for a return to 3–4% rates any time soon.
What this means for your cash-on-cash math: underwrite new deals at your actual quoted rate (not last year’s rate, and not a hoped-for future rate), and expect that rate to be close to where it is today for the foreseeable future.
4. Real-World Example: The Same Property at 3% vs. Today’s Rates
Numbers make this concrete. Consider a hypothetical $280,000 rental property, financed with 25% down ($70,000), plus $5,600 in closing costs and $3,000 in initial repairs — $78,600 total cash invested. Assume gross annual rent of $28,800 and operating expenses of $9,600, for NOI of $19,200 (a 6.9% cap rate on the purchase price).
| 3% Rate (2021-era) | 6.7% Rate | 7.4% Rate (Investor Premium) | |
| Loan Amount | $210,000 | $210,000 | $210,000 |
| Annual Mortgage Payment (P&I) | ~$10,630 | ~$16,270 | ~$17,470 |
| Annual Cash Flow (NOI − Payment) | ~$8,570 | ~$2,930 | ~$1,730 |
| Cash-on-Cash Return | ~10.9% | ~3.7% | ~2.2% |
Figures are illustrative and rounded; your actual payment depends on exact term, taxes, insurance, and lender pricing.
The property itself didn’t change — same rent, same expenses, same 6.9% cap rate. What changed is how much of the NOI gets consumed by debt service. At 3%, the investor kept over half their NOI as cash flow. At 7.4%, they keep about 9% of it. This is the entire story of why “the same deal” can look completely different depending only on when you financed it.
5. Cap Rate vs. Cash-on-Cash Return: Why the Spread Between Them Matters
Cap rate and cash-on-cash return often get confused, but the gap between them is one of the most useful diagnostic numbers in real estate investing.
- Cap rate = NOI ÷ Purchase Price. It tells you the return if you paid cash, with no loan at all.
- Cash-on-cash return = Cash Flow ÷ Cash Invested. It tells you your actual return with leverage.
When your mortgage rate is lower than the property’s cap rate, leverage works in your favor: borrowed money earns more than it costs, and cash-on-cash return exceeds cap rate. When your mortgage rate is higher than the cap rate — which is common in 2026, with many single-family rentals trading around a 5–7.3% national average cap rate against 7%+ investor financing — leverage works against you, and cash-on-cash return falls below cap rate.
Checking this spread before you commit to a deal takes thirty seconds and tells you immediately whether debt is helping or hurting: if your quoted rate is above the property’s cap rate, expect cash-on-cash return to underperform the cap rate, not beat it.
6. Negative Leverage: When Debt Works Against You
The situation described above — mortgage rate above cap rate — has a name: negative leverage. It means every additional dollar you borrow reduces your return rather than amplifying it, because the cost of that dollar (interest) exceeds what it earns (the property’s yield).
Negative leverage isn’t automatically a dealbreaker, but it changes the math on how much debt makes sense. In a positive-leverage environment, maximizing your loan amount (minimizing your down payment) generally boosts cash-on-cash return. In a negative-leverage environment, the opposite is often true: putting more cash down and borrowing less can actually raise your cash-on-cash return, because you’re avoiding debt that costs more than it produces.
This is a genuine shift in strategy from the low-rate years, and it’s one of the most common blind spots for investors who learned the “maximize leverage” playbook during 2020–2021 and haven’t adjusted it for 2026 rates.
7. DSCR and Financing: How Rate Increases Affect Loan Qualification
Debt Service Coverage Ratio (DSCR) is the metric most investor-property lenders use to decide whether they’ll fund a deal, especially for DSCR loan products that qualify borrowers on the property’s income rather than personal W-2s or tax returns.
DSCR = Annual NOI ÷ Annual Debt Service
Most lenders want to see a DSCR of at least 1.0–1.25, with the best pricing reserved for 1.25+ and strong credit. Using the $19,200 NOI example above against a roughly $17,470 annual payment at 7.4%, DSCR comes out to about 1.10 — inside financeable territory for many DSCR lenders, but below the threshold that unlocks the best rate tier, and potentially too thin for a conventional lender’s overlays.
Here’s the connection to cash-on-cash return that a lot of investors miss: the same rate increase that shrinks your cash-on-cash return also shrinks your DSCR, because both are driven by the same rising annual debt-service figure. A deal that looks marginal on a cash-on-cash basis at today’s rates is often the same deal a lender will flag as marginal on a DSCR basis — the two numbers tend to move together, which is a useful cross-check before you make an offer.
8. Market-by-Market Impact: Where Deals Still Pencil in 2026
Not every market responds to high rates the same way, because cap rates vary widely by region. According to Arbor Realty Trust’s Q1 2026 Single-Family Rental Investment Trends report, national SFR cap rates rose to roughly 7.3% by late 2025 — nearly two full percentage points higher than in 2021 — while multifamily cap rates have held closer to 5.7% nationally, with some forecasters expecting a gradual decline toward the low-5% range as financing conditions ease.
| Market Type | Typical Cap Rate Range | Leverage Position at ~7.4% Investor Rates |
| High-cost coastal metros | 2–4% | Deep negative leverage; cash flow is thin to negative |
| Major Sunbelt metros | 4–6% | Negative leverage; borderline cash-on-cash returns |
| Secondary Sunbelt/Midwest metros | 6–7.3%+ | Closer to breakeven or mild positive leverage |
The takeaway isn’t “avoid expensive markets” — appreciation-driven investors buy there for reasons other than cash flow. It’s that if cash-on-cash return is your primary goal in 2026, the markets where cap rates run closest to (or above) your financing rate are the ones where the math is most likely to work without heroic assumptions.
9. Stress-Testing Your Deal Against Rate and Vacancy Risk
Because rates have moved before and can move again, it’s worth underwriting every deal at more than just today’s quoted rate. A simple stress test: run your cash-on-cash calculation at your actual rate, then again at +1 percentage point, and once more assuming 8–10% vacancy instead of 0%.
If cash flow turns negative under any of those scenarios, the deal has little margin for error — a single vacancy, a rate reset on a variable loan, or an unexpected repair could push it underwater. If cash flow stays positive across all three scenarios, you have a genuine cushion. This kind of scenario testing takes a few extra minutes and is one of the clearest ways to separate a deal that “looks fine on paper today” from one that can actually absorb bad luck.
10. Strategies to Protect or Improve Cash-on-Cash Return in a High-Rate Environment
A few adjustments meaningfully change the outcome under 2026 rate conditions:
- Increase your down payment. Because negative leverage means borrowed dollars cost more than they earn, putting more cash down and taking a smaller loan can raise, not lower, your cash-on-cash return — the opposite of the low-rate playbook.
- Target markets where cap rates meet or exceed your financing rate. This is the single biggest lever, since it determines whether leverage helps or hurts before you even sign.
- Raise NOI directly. Modest rent increases or expense reductions flow straight into cash flow, since they don’t require refinancing or waiting on the market.
- Compare your maximum supportable offer, not the asking price. Work backward from your target cash-on-cash return to figure out what you can actually pay, rather than anchoring to the seller’s number.
- Shop DSCR and conventional financing side by side. With rates spanning roughly 6.0–8.5% across loan products, the difference between the best and worst quote for the same deal can be more than a full percentage point.
- Keep 3–6 months of PITI (principal, interest, taxes, insurance) in reserve per property, since thinner cash flow margins leave less room to self-fund a vacancy or repair.
- Treat any future rate relief as upside, not your investment thesis. With MBA and Fannie Mae both projecting rates in the mid-6% to high-6% range through 2027, underwriting to a hoped-for rate cut is a bet, not a strategy.
11. Common Mistakes Landlords Make When Rates Are High
A few underwriting habits become especially costly at today’s rates:
- Assuming 0% vacancy. Even 6–8% vacancy meaningfully lowers effective rent, and thin cash-flow margins have no room to absorb it.
- Excluding closing costs and rehab from “cash invested.” Using only the down payment understates your denominator and overstates your real return.
- Lumping capital expenditures in with routine maintenance. Roofs, HVAC systems, and appliances need their own reserve, especially on older properties.
- Chasing appreciation while ignoring cash flow. In a higher-for-longer rate environment, income growth — not cap rate compression — is doing most of the work on total returns.
- Reusing a pre-2022 mental model of leverage. Maximizing loan size made sense when rates were below cap rates. At today’s rates, that assumption often needs to be reversed.
12. Comparing Two Properties: A Simple Decision Framework
When you’re choosing between two rental properties, run the same four numbers side by side rather than comparing sticker price or curb appeal:
| Metric | Property A | Property B |
| Cap Rate | ||
| Mortgage Rate Quoted | ||
| Cash-on-Cash Return | ||
| DSCR |
The property with the higher cash-on-cash return isn’t automatically the better buy if its DSCR is dangerously thin or its cap rate barely exceeds its mortgage rate — that combination signals a deal with little room for rate or vacancy surprises. The strongest candidates tend to show cap rate at or above the financing rate, cash-on-cash return in the high single digits or better, and DSCR comfortably above 1.25.
13. Should You Wait for Rates to Drop, or Buy Now?
This is one of the most common questions landlords ask when rates are elevated, and it doesn’t have a universal answer — but the current forecast data is worth knowing. The MBA projects 30-year rates averaging in the 6.6–6.7% range through 2026, and Fannie Mae’s forecast sits slightly higher, around 6.7–6.8%, with both expecting similarly little movement into 2027.
That doesn’t mean rates definitely won’t fall — they can and do move based on inflation data, employment reports, and Federal Reserve decisions (the next of which lands September 15–16, 2026). But waiting on a rate drop that isn’t currently forecast means potentially missing cash-flowing deals in the meantime. Investors who underwrite conservatively to today’s actual rate — and treat any future rate cut as a bonus refinance opportunity rather than the reason the deal works — tend to make decisions they don’t regret if rates stay flat.
14. Tax and Depreciation Considerations That Can Offset Rate Pressure
Cash-on-cash return measures pre-tax cash flow, but it isn’t the whole financial picture. Rental property depreciation can shelter a meaningful portion of your taxable income even when cash flow is thin, and mortgage interest itself is generally deductible — meaning some of the extra cost from a higher rate is partially offset at tax time, depending on your bracket and situation.
This is genuinely individual: depreciation recapture, passive activity loss limitations, and state-specific tax treatment all affect the real after-tax picture differently for different investors. This section is educational, not tax advice — a CPA familiar with real estate can tell you how much of the rate increase you’re actually absorbing after taxes versus before.
More Explore: https://calclandlord.com/rental-property-cash-flow/
15. People Also Ask: High Mortgage Rates and Cash-on-Cash Returns
Many experienced buy-and-hold investors still target roughly 8–12%, though 5–8% is common and often acceptable in markets where appreciation potential offsets thinner cash flow.
It depends on loan size, but on a $210,000 loan, a 1-point rate increase typically adds somewhere in the range of $120–$150 per month in additional interest cost — money that comes directly out of cash flow.
Yes. DSCR loan rates in 2026 span roughly 6.0% to 8.5% depending on your DSCR ratio, credit score, and down payment, and remain a standard financing route for investors who don’t want to qualify on personal income.
Often, yes — when your mortgage rate exceeds the property’s cap rate (negative leverage), a larger down payment and smaller loan can raise your cash-on-cash return rather than lower it, which is the reverse of how leverage behaves when rates are low.
Markets where cap rates run closest to or above current financing rates — often secondary Sunbelt and Midwest metros with cap rates in the 6–7%+ range — tend to produce stronger cash-on-cash returns than high-cost coastal markets with 2–4% cap rates.
Key Takeaways
- Cash-on-cash return falls when mortgage rates rise because your NOI stays fixed while your debt service climbs — the entire effect flows through the numerator of the formula.
- As of early September 2026, 30-year fixed rates average about 6.7%, with investment property rates typically 0.5–0.875 points higher (roughly 7.2–7.6%) and DSCR loans spanning 6.0–8.5%.
- When your mortgage rate exceeds a property’s cap rate, you’re in negative leverage — and the old “maximize your loan” strategy can work against you.
- Stress-test every deal at +1% rate and realistic vacancy before you commit.
- No major forecaster currently expects a return to 3–4% rates; underwrite to today’s numbers, not a hoped-for future rate.
Next step: Run your specific numbers through a cash-on-cash return calculator before making an offer — the difference between “close to breakeven” and “clearly negative leverage” often comes down to details (exact rate, escrow items, vacancy assumption) that are easy to get wrong doing quick mental math.
Educational content only — not financial, tax, or legal advice. Mortgage rates, loan terms, and tax rules change and vary by lender, state, and individual circumstances; verify current numbers with your lender and consult a qualified professional before making investment decisions.
