

Property Analysis: A Landlord’s Step-by-Step Guide to Evaluating Rental Deals
Most rental deals don’t die at closing. They die months earlier, in a spreadsheet nobody actually filled in. A property can look perfect on the listing photos and still lose you money every single month, because the seller’s rent estimate was optimistic, the maintenance reserve was never budgeted, or the vacancy allowance was quietly left out. Property analysis is the one habit that separates landlords who build wealth from landlords who inherit surprises. It takes twenty minutes, four formulas, and a healthy dose of skepticism. Here’s the exact framework to run before you ever make an offer.
Every landlord who’s been in this business more than a few years has a story about the deal that looked great on the flyer and fell apart under real numbers. Property analysis is what stands between you and that story.
It’s not a formality you rush through to get to closing. It’s the process that tells you, in dollars, whether a property will make you money — and how much cushion you have if things don’t go perfectly.
This guide walks through the same framework professional landlords and small-portfolio investors use: how to pull the numbers, which formulas matter, where the real risk hides, and how to avoid the mistakes that turn a “great deal” into a money pit.
What Property Analysis Really Means for Landlords and Investors
Property analysis is the process of evaluating a rental property’s income potential, expenses, condition, and risk before you buy — or before you decide to keep holding it.
For a landlord, this isn’t the same exercise a house flipper or a commercial REIT runs. You’re not just asking “will this appreciate?” You’re asking a narrower, more practical question: will this property generate reliable income after every bill is paid, month after month, tenant after tenant?
That means property analysis for a landlord centers on three things:
- Income reliability — what rent can you actually collect, not what a listing claims
- Expense accuracy — every recurring cost, not just the mortgage
- Risk exposure — vacancy, deferred maintenance, tenant turnover, and market shifts
Everything else in this guide builds toward answering those three questions with real numbers instead of guesses.
Why Skipping Property Analysis Is the Most Expensive Mistake in Real Estate
Rental properties are forgiving of small mistakes and unforgiving of big ones. A property purchased without proper analysis tends to fail in one of three predictable ways:
Negative cash flow that isn’t obvious at first. The mortgage, taxes, and insurance are easy to find. Maintenance reserves, vacancy allowance, and property management aren’t listed anywhere — landlords who skip them routinely discover their “$300/month cash flow” property actually breaks even, or loses money, once real expenses hit.
Hidden capital expenses. A roof with five years left, an aging HVAC system, or outdated electrical can turn a good year into a bad one. Analysis without a condition assessment is analysis of half the picture.
Overpaying relative to rent. Buying at a price the local rent can’t support means you’re betting entirely on appreciation — a much riskier position than owning a property that cash-flows from day one.
Thorough analysis doesn’t eliminate risk. It converts unknown risk into known, priced-in risk — the kind you can plan around instead of getting blindsided by.
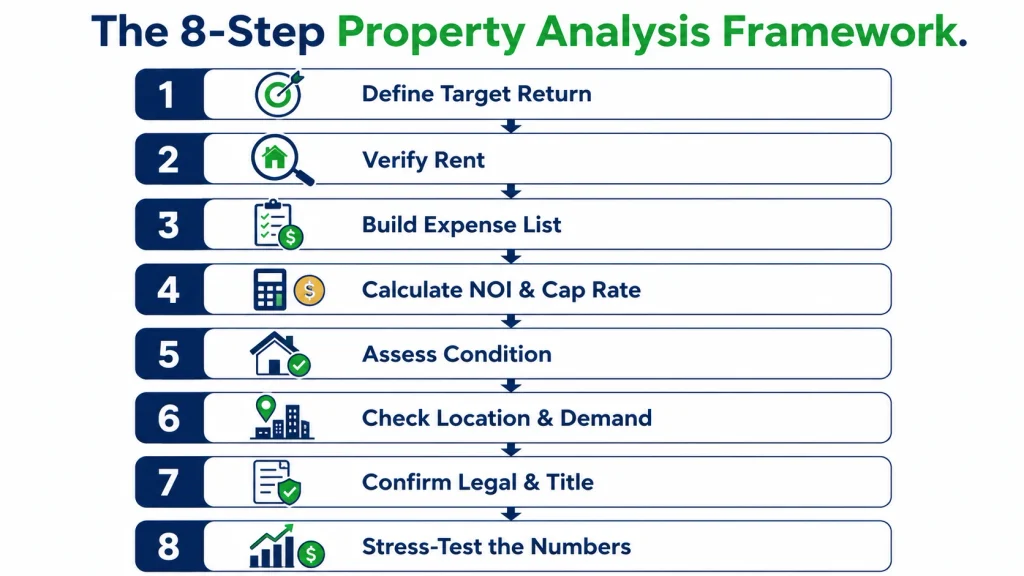
The Property Analysis Framework: 8 Steps Before You Make an Offer
Use this sequence for every property you seriously consider. Each step either qualifies or disqualifies the deal before you move to the next.
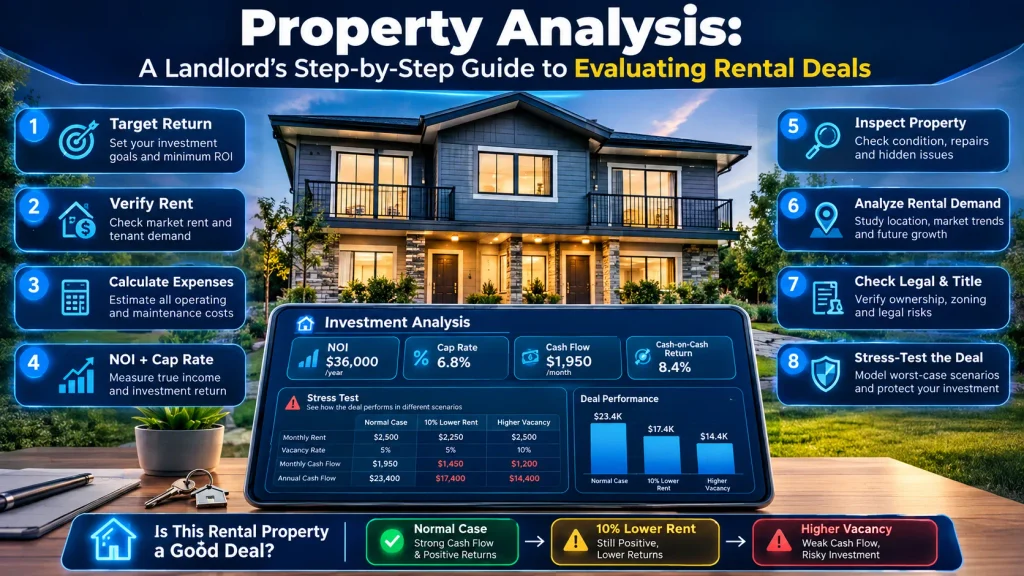
1. Define your target return. Decide your minimum acceptable cap rate, cash-on-cash return, and cash flow per unit before you look at listings. This keeps you from rationalizing a bad deal because you’re emotionally attached to a property.
2. Verify actual achievable rent. Pull at least three to five comparable active listings and, if possible, recently leased comps — not the seller’s rent projection.
3. Build the expense list. Taxes, insurance, maintenance reserve, vacancy allowance, property management (even if you self-manage, price it — your time isn’t free), utilities if owner-paid, and HOA if applicable.
4. Calculate NOI, cap rate, cash flow, and cash-on-cash return. These four numbers, together, tell you almost everything about the deal’s financial shape. Covered in detail below.
5. Assess the property’s physical condition. A professional inspection, plus your own walkthrough focused on roof age, HVAC age, plumbing, electrical panel capacity, and foundation.
6. Check location and rental demand fundamentals. Job growth, vacancy rates in the immediate submarket, and school quality if you’re targeting family tenants.
7. Confirm legal and title status. Clear title, zoning compliance, permit history for any additions or conversions, and any open code violations.
8. Stress-test the numbers. Rerun your cash flow assuming rent is 10% lower and vacancy is double what you assumed. If the deal still works, it’s solid. If it only works in the best case, it isn’t.
Location and Rental Demand Analysis
A property can have perfect numbers on paper and still be a bad buy if the local rental market can’t support them long-term.
Look at three layers:
- Macro market — is the metro area gaining population and jobs, or losing them?
- Submarket — what’s the vacancy rate and rent trend in this specific zip code over the last two to three years?
- Micro location — proximity to employment, schools, transit, and grocery/retail, which directly affects tenant demand and turnover rates
Practical research sources: local MLS rent comps, HUD Fair Market Rent data for your county, and current listings on rental sites filtered to comparable unit types within a mile or two.
A useful gut check: ask a local property manager how long a similar unit typically sits vacant between tenants. If the honest answer is “a month or more,” build that vacancy cost into your numbers — don’t assume you’ll be the exception.
Financial Analysis: NOI, Cap Rate, Cash-on-Cash, and ROI
This is the core of property analysis. Four numbers, calculated correctly, tell you almost everything.
Net Operating Income (NOI)
Formula: NOI = Gross Rental Income − Operating Expenses (before mortgage payment)
NOI is the property’s profitability from operations alone, independent of how you finance it. It’s the foundation every other metric is built on.
Example: A duplex renting both units for $1,400/month each generates $33,600/year in gross rent. Annual operating expenses (taxes, insurance, maintenance reserve, vacancy allowance, and management) total $12,600. NOI = $33,600 − $12,600 = $21,000.
Capitalization Rate (Cap Rate)
Formula: Cap Rate = NOI ÷ Purchase Price
Cap rate lets you compare properties at different price points on equal footing, since it strips out financing.
Example: On the duplex above, purchased for $280,000: Cap Rate = $21,000 ÷ $280,000 = 7.5%.
Cap rates that count as “good” vary a lot by market — a 7.5% cap rate is strong in many Midwest and Sun Belt secondary markets, while it would be unusually high in a coastal metro where investors accept lower yields for stronger appreciation. Use this calculation alongside CalcLandlord’s cap rate calculator to compare it against local benchmarks.
Cash Flow and Cash-on-Cash Return
Cash flow formula: Annual Cash Flow = NOI − Annual Debt Service (mortgage principal + interest)
Cash-on-cash formula: Cash-on-Cash Return = Annual Cash Flow ÷ Total Cash Invested (down payment + closing costs + any initial repairs)
Example continued: Annual mortgage payments on the duplex total $15,400. Cash Flow = $21,000 − $15,400 = $5,600/year, or about $467/month. If the total cash invested (20% down plus closing costs) was $62,000: Cash-on-Cash Return = $5,600 ÷ $62,000 = 9.0%.
Return on Investment (ROI)
ROI takes a longer view, adding appreciation and mortgage principal paydown to cash flow over the full holding period, then dividing by total cash invested. It’s the right metric for evaluating a hold-and-sell decision years out, not for a quick first-pass screen.
Property Analysis Formula Cheat Sheet (with Worked Examples)
| Metric | Formula | Duplex Example |
| Gross Rental Income | Sum of all unit rents × 12 | $33,600 |
| Operating Expenses | Taxes + insurance + maintenance + vacancy + management | $12,600 |
| NOI | Gross Income − Operating Expenses | $21,000 |
| Cap Rate | NOI ÷ Purchase Price | 7.5% |
| Annual Cash Flow | NOI − Annual Debt Service | $5,600 |
| Cash-on-Cash Return | Cash Flow ÷ Cash Invested | 9.0% |
| Gross Rent Multiplier | Purchase Price ÷ Gross Annual Rent | 8.3 |
Rule of thumb: No single formula tells the whole story. Cap rate ignores financing; cash-on-cash ignores appreciation; GRM ignores expenses entirely. Run all of them together.
Single-Family vs. Multifamily Property Analysis: What Changes
The math is the same, but the risk profile is different, and that changes how you should weigh the results.
Single-family rentals: One tenant, one income stream. If that tenant leaves or stops paying, your income drops to zero until you re-lease — a much sharper cliff than multifamily. On the upside, expenses are usually simpler (often no shared systems), and resale liquidity is typically higher since you’re selling to both investors and owner-occupants.
Multifamily (2–4 units, the typical small-landlord range): Vacancy in one unit doesn’t zero out your income — the other units keep paying. Expenses can be more complex if utilities or maintenance are shared. Financing terms and appraisal methods also differ (multifamily is valued more on income, single-family more on comparable sales), which affects how sensitive your purchase price is to your NOI number.
Practical takeaway: if you’re risk-averse to income gaps, multifamily’s built-in diversification is worth factoring into your target return — you may reasonably accept a slightly lower cap rate for that stability.
Physical Condition and Deferred Maintenance Checklist
Numbers on a spreadsheet mean nothing if the roof needs replacing in year two. Before finalizing any offer, verify:
- Roof age and remaining life
- HVAC system age and service history
- Water heater age
- Electrical panel capacity and condition (especially in older homes — knob-and-tube or aluminum wiring are red flags)
- Plumbing material (original galvanized pipe in an older property is a future expense, not a maybe)
- Foundation — visible cracking, settling, or drainage issues
- Windows and insulation quality (affects utility costs if owner-paid)
Budget a maintenance reserve as a percentage of rent (commonly 5–10%) even on a property that looks turnkey — every property needs capital reinvestment eventually, and pretending otherwise is how “cash-flowing” properties quietly stop cash-flowing.

Legal, Title, and Zoning Due Diligence
This step protects you from problems that no amount of rent can outrun.
- Clear title — confirm through a title search that the seller can legally convey the property and there are no undisclosed liens
- Zoning compliance — confirm the property is legally permitted to be a rental (this matters especially for conversions, ADUs, or short-term rental intentions)
- Permit history — verify any additions, unit splits, or major renovations were permitted; unpermitted work can complicate financing, insurance, and resale
- Open code violations — check with the local municipality
- Landlord-tenant compliance — if the property is already occupied, confirm existing leases, security deposit handling, and local rent-control or notice-period rules
Landlord-tenant law and tax treatment vary significantly by state and even by city — confirm specifics with a local real estate attorney and CPA before closing.
Case Study: Analyzing a Duplex in a Mid-Size Market
The listing: $280,000 duplex, seller claims $1,500/unit rent is achievable ($36,000/year gross).
Step 1 — Verify rent: Comparable units in the immediate area are actually leasing for $1,350–$1,400/month. Using the conservative end: $1,400 × 2 × 12 = $33,600/year.
Step 2 — Build expenses: Property taxes $3,600, insurance $1,400, maintenance reserve (8%) $2,688, vacancy allowance (5%) $1,680, property management (8%) $2,688, miscellaneous $544. Total: $12,600.
Step 3 — NOI: $33,600 − $12,600 = $21,000
Step 4 — Cap rate: $21,000 ÷ $280,000 = 7.5%
As Step 5 — Financing (20% down, 7% rate, 30-year): Loan amount $224,000, annual debt service roughly $15,400.
Step 6 — Cash flow: $21,000 − $15,400 = $5,600/year ($467/month)
Step 7 — Stress test: Rerun with rent 10% lower ($30,240/year) and vacancy doubled to 10%. Adjusted NOI drops to roughly $16,500, cash flow falls to about $1,100/year — thin, but still positive. Verdict: the deal holds up under pressure, which is the real test.
Case Study: Running the Numbers on a BRRRR Deal
The property: distressed 4-unit building, purchase price $220,000, rehab budget $60,000, after-repair value (ARV) $340,000.
Total cash needed: Purchase + rehab + closing + holding costs ≈ $295,000
Post-rehab rent: 4 units × $950/month = $3,800/month, or $45,600/year
Operating expenses (using a 40% expense ratio for an older multifamily): $18,240/year
NOI: $45,600 − $18,240 = $27,360
Refinance at 75% of ARV: $340,000 × 75% = $255,000 new loan, recovering a substantial portion of the original cash invested.
Result: After refinancing, remaining cash left in the deal is significantly reduced while the property continues cash-flowing — the core appeal of the BRRRR strategy. Run your own numbers through CalcLandlord’s BRRRR calculator before committing to a rehab budget, since refinance appraisals can come in below projected ARV.
Property Analysis Metrics Comparison Table
| Metric | Best For | Limitation |
| NOI | Baseline profitability, any property | Doesn’t account for financing |
| Cap Rate | Comparing properties across price points | Ignores your specific loan terms |
| Cash Flow | Real monthly income after debt service | Doesn’t reflect long-term return |
| Cash-on-Cash | Evaluating financing efficiency | Sensitive to down payment size |
| ROI | Long-term hold/sell decisions | Requires appreciation assumptions |
| GRM | Fast initial screening | Ignores expenses entirely |
7 Property Analysis Mistakes That Kill Returns
1. Trusting the seller’s rent projection. Always verify against independent comps.
2. Forgetting vacancy allowance. Even great units sit empty between tenants — budget for it.
3. Underpricing property management. If you self-manage today, price it anyway; your circumstances may change.
4. Ignoring deferred maintenance. A cheap purchase price can hide an expensive roof.
5. Skipping the stress test. A deal that only works at 100% occupancy and best-case rent isn’t a safe deal.
6. Overlooking landlord-tenant law differences. Notice periods, security deposit caps, and eviction timelines vary by state and directly affect your risk.
7. Analyzing in isolation. Comparing one property against your gut feeling instead of against several alternatives leads to overpaying.
More Explore: https://calclandlord.com/roi-returns/
Property Analysis Checklist (Downloadable)
Financial
- [ ] Rent verified against 3–5 independent comps
- [ ] Full expense list built (taxes, insurance, maintenance, vacancy, management)
- [ ] NOI, cap rate, cash flow, and cash-on-cash calculated
- [ ] Numbers stress-tested at lower rent / higher vacancy
Physical
- [ ] Professional inspection completed
- [ ] Roof, HVAC, plumbing, electrical, foundation assessed
- [ ] Maintenance reserve budgeted
Legal
- [ ] Title search clear
- [ ] Zoning and permit history confirmed
- [ ] No open code violations
- [ ] Existing leases and deposits reviewed (if occupied)
Market
- [ ] Local vacancy rate and rent trend checked
- [ ] Comparable properties reviewed
- [ ] Exit/resale liquidity considered
People Also Ask About Property Analysis
It depends heavily on market. Many secondary and Midwest/Sun Belt markets see 6–9% cap rates for solid rentals, while high-appreciation coastal metros often run 3–5%. Compare against similar properties in the same submarket rather than a national average.
Use the 50% rule as a first filter: assume roughly half of gross rent goes to operating expenses. If what’s left doesn’t comfortably cover the mortgage payment, the deal likely isn’t worth a deeper look.
The formulas are identical, but single-family income depends on one tenant, while multifamily spreads risk across multiple units. Multifamily financing is also more income-driven, so an accurate NOI matters even more for appraisal purposes.
Yes. Cosmetic condition tells you little about roof age, electrical capacity, or plumbing material — the expenses that actually hurt cash flow.
Depreciation doesn’t change your cash flow, but it reduces your taxable income, which improves your after-tax return. It’s worth modeling separately once a property clears your cash-flow and cap-rate thresholds — see CalcLandlord’s depreciation guide for the mechanics.
Conclusion
Property analysis isn’t a Single Formula — it’s a sequence: verify income, build real expenses, calculate NOI and the metrics that follow from it, inspect the physical property, confirm the legal status, and stress-test everything before you commit. Properties that survive that full sequence tend to be the ones that keep paying you, year after year, long after the excitement of closing day has worn off.
Use The Calclulator