

How to Calculate Per-Unit Economics for Small Multifamily Properties
A fourplex with the lowest price per door isn’t automatically the best deal — and in the worked example below, it’s actually the one with the weakest NOI per unit. That’s the trap with small multifamily math: total dollars hide what’s really happening per unit, and per-unit metrics can point in opposite directions depending on which one you check. Price per door tells you acquisition cost. NOI per unit tells you operating performance. Cash flow per unit tells you what you actually keep after financing. Here’s every formula you need, plus a side-by-side duplex, triplex, and fourplex comparison that shows exactly where “more units = better deal” breaks down.
Per-unit economics means dividing every major number on a small multifamily property — purchase price, income, expenses, NOI, and cash flow — by the number of units, so you can compare a duplex, triplex, and fourplex on equal footing instead of comparing total dollar figures that don’t account for size. The core calculations are price per door, revenue per unit, expense per unit, NOI per unit, and cash flow per unit.
Small multifamily properties (2–4 units) are unique because they still qualify for residential financing, but their price, rent roll, and expense structure can vary enormously between a duplex and a fourplex. Comparing them by total price or total NOI alone hides which one is actually the better deal per dollar invested. This guide walks through the exact formulas, a labeled worked example, the assumptions each calculation depends on, and where the “more units = better economics” assumption commonly breaks down.
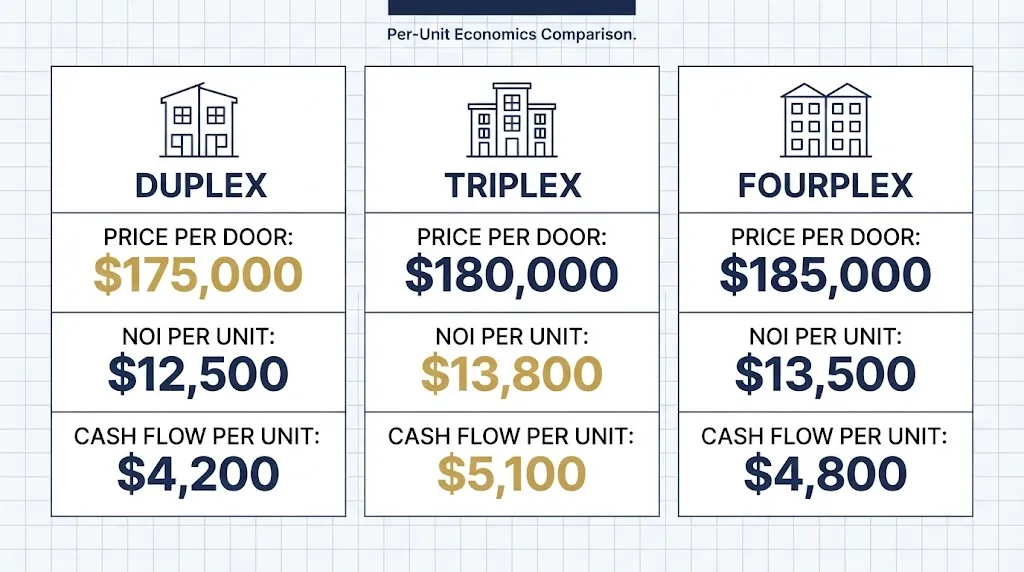
What Per-Unit Economics Means
Per-unit economics normalizes property-level financials to a single-unit basis. A $600,000 duplex and a $600,000 fourplex are not comparable investments as total-dollar figures — the fourplex is producing income from twice as many doors. Per-unit metrics remove size as a variable so you’re comparing efficiency, not scale.
This matters specifically for 2–4 unit properties because:
- They compete against each other for the same buyer pool and often the same financing programs (conventional and, for owner-occupants, FHA loans up to four units).
- Purchase price and rent per unit typically don’t scale linearly with unit count.
- Fixed costs (roof, land, foundation, some insurance and tax components) are shared across more units as unit count rises, which is the mechanical reason “economies of scale” exist — but the effect on income per unit is a separate question, addressed below.
The Core Formulas
Price Per Door
Price Per Door = Purchase Price ÷ Number of Units
The fastest normalization for comparing properties of different sizes. Lower price per door means a lower acquisition cost per income stream — but on its own it says nothing about whether that income stream is any good, which is why the next several metrics matter.
Revenue Per Unit
Revenue Per Unit = Gross Annual Rental Income ÷ Number of Units
Use trailing (actual, historical) rent for an existing property. Use verified local comps, not the listing’s marketed “market rent,” if you’re underwriting a vacant or newly acquired property. If unit sizes or bedroom counts vary by more than roughly 20%, also calculate revenue per bedroom or per square foot — a straight per-unit average can be misleading on a mixed-unit-size property.

Operating Expense Per Unit
Expense Per Unit = Total Annual Operating Expenses ÷ Number of Units
Operating Expense Ratio = Total Operating Expenses ÷ Gross Rental Income
Rule of thumb, not a fixed law: small multifamily operating expenses (taxes, insurance, maintenance, capex reserve, property management, vacancy — excluding debt service) commonly fall in the 35–45% of gross rent range. Actual ratios vary by property age, self-management vs. professional management, and local tax and insurance costs. Verify against the specific property’s trailing expenses whenever they’re available.
Net Operating Income (NOI) Per Unit
As NOI = Gross Rental Income − Operating Expenses (excludes debt service)
NOI Per Unit = NOI ÷ Number of Units
NOI per unit is the cleanest cross-size comparison metric because it excludes financing structure and isolates operating performance per door. It’s also the number appraisers and most lenders anchor valuation to.
Cap Rate
Cap Rate = NOI ÷ Purchase Price
Not a per-unit figure on its own, but the link between NOI per unit and price per door: strong NOI per unit at a mediocre cap rate signals the property is priced above what its own income supports.
Cash-on-Cash Return and Cash Flow Per Unit
Annual Cash Flow = NOI − Annual Debt Service
Cash-on-Cash Return = Annual Cash Flow ÷ Total Cash Invested
Cash Flow Per Unit = Annual Cash Flow ÷ Number of Units
This is the return figure that reflects what a leveraged buyer actually keeps. Financing terms (rate, term, down payment) can reorder which property — duplex, triplex, or fourplex — looks best, even when unlevered NOI per unit is similar across all three.
Debt Service Coverage Ratio (DSCR)
DSCR = NOI ÷ Annual Debt Service
Rule of thumb: many lenders look for a DSCR of at least 1.20–1.25 on small multifamily property — meaning NOI should exceed debt service by 20–25%. Confirm the actual minimum with your specific lender, since it varies by loan program and lender risk appetite.
Break-Even Occupancy
Break-Even Occupancy = (Operating Expenses + Debt Service) ÷ Gross Potential Rental Income
For a duplex, one vacant unit is 50% of gross income gone. For a fourplex, it’s 25%. Break-even occupancy quantifies the actual dollar cushion each unit count provides, rather than relying on the general claim that more units automatically means lower risk.
Step-by-Step Process
- Pull actual trailing 12-month income and expenses. Use verified rent comps, not agent pro forma, for vacant or newly listed properties.
- Convert every income and expense line to a per-unit basis.
- Calculate NOI and NOI per unit.
- Compare price per door against NOI per unit to check whether the asking price is supported by actual income.
- Model your real financing terms (your quoted rate, term, and down payment — not a generic assumption) to get debt service, then calculate cash-on-cash return and cash flow per unit.
- Stress-test with break-even occupancy, assuming one unit sits vacant for 60–90 days.
- Compare against at least one alternative unit count in the same submarket and price range before deciding.

Worked Example (Hypothetical — Not a Real Property)
The figures below are illustrative only, built to demonstrate the mechanics of the calculations. They are not based on an actual listing, and they should not be used as a benchmark for any specific market. Financing assumption: 25% down, 30-year fixed loan.
Rate assumption: Freddie Mac’s Primary Mortgage Market Survey put the national average 30-year fixed rate at 6.71% as of September 3, 2026. Investment-property loans typically price higher than owner-occupied primary-residence rates due to risk-based pricing; this example uses 7.25% as an illustrative investor-loan assumption. Confirm your own rate with a lender — do not use this figure as a current quote.
| Metric | Duplex | Triplex | Fourplex |
| Purchase price | $380,000 | $540,000 | $680,000 |
| Price per door | $190,000 | $180,000 | $170,000 |
| Monthly rent per unit | $1,550 | $1,500 | $1,450 |
| Gross annual rental income | $37,200 | $54,000 | $69,600 |
| Operating expenses (38% assumption) | $14,136 | $20,520 | $26,448 |
| Expense per unit | $7,068 | $6,840 | $6,612 |
| Net Operating Income (NOI) | $23,064 | $33,480 | $43,152 |
| NOI per unit | $11,532 | $11,160 | $10,788 |
| Cap rate | 6.07% | 6.20% | 6.35% |
| Down payment (25%) | $95,000 | $135,000 | $170,000 |
| Annual debt service (7.25%, 30-yr, approx.) | $23,340 | $33,190 | $41,740 |
| Annual cash flow | −$276 | $290 | $1,412 |
| Cash flow per unit | −$138 | $97 | $353 |
| Break-even occupancy | 98.3% | 99.1% | 98.6% |
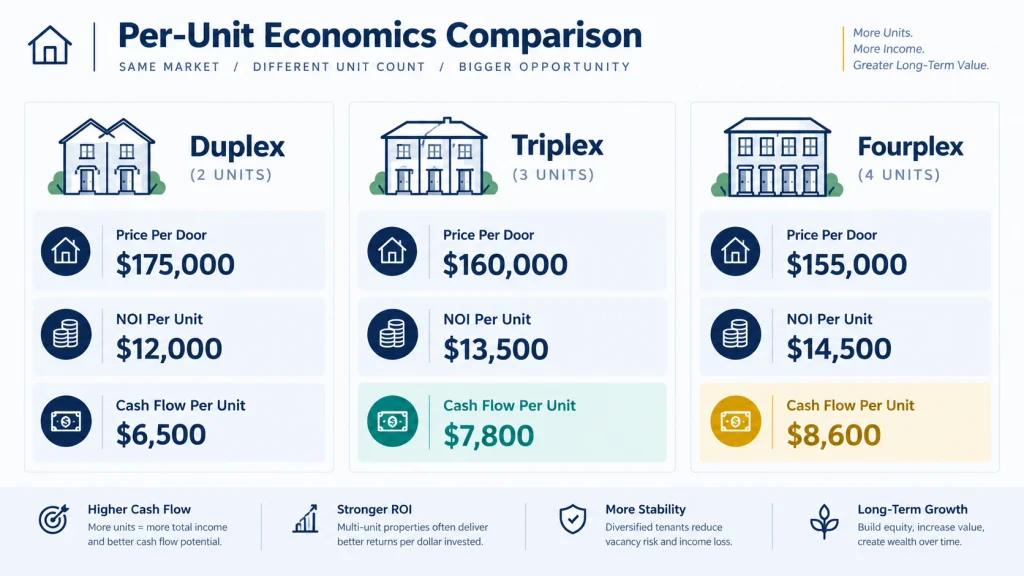
What the example illustrates, and what it doesn’t:
- Price per door falls as unit count rises, confirming lower per-door acquisition cost — but only at the acquisition level, not automatically in income terms.
- NOI per unit declines slightly as unit count rises here because rent per unit is lower in the larger buildings, even though expenses per unit are also lower. Whether this pattern holds in a real market depends entirely on local rent comps for each unit size — it is not a universal rule.
- Cash flow per unit and cash-on-cash return improve with unit count in this example because the lower price per door means less debt per unit relative to the income each unit produces.
- Break-even occupancy doesn’t improve monotonically with unit count once financing is applied at this leverage — contradicting the common blanket claim that more units always means lower risk. The real relationship depends on the deal’s specific price, rent, and loan terms, not unit count alone.
Run these calculations with real comps and an actual lender quote before acting on any property. Use CalcLandlord’s Unit Economics Calculator to enter your own purchase price, income, expenses, and debt service and get cost-per-unit, NOI-per-unit, and cash-flow-per-unit instantly — it applies the same formulas shown above.
Where the Calculation Breaks Down (Common Mistakes)
Averaging across an unbalanced unit mix. A triplex with two 3-bedroom units and one studio produces a misleading “revenue per unit” average. Calculate revenue per bedroom or per square foot alongside revenue per unit when unit sizes vary significantly.
Ignoring utility structure. If the owner currently pays water, gas, or trash for all units — common on older duplexes and triplexes with shared meters — that cost doesn’t shrink proportionally with unit count. Sub-metering and shared-system maintenance can offset the expected per-unit cost advantage.
Using pro forma rent instead of trailing rent. Listings often show a “market rent” projection assuming immediate turnover. Underwrite on in-place trailing rent first, then run a separate scenario for post-turnover or post-renovation rent if that’s realistic for the specific property.
Skipping capital expenditure reserves. A roof or HVAC replacement costs more in absolute dollars on a fourplex than a duplex, even at a lower cost per unit. Budget a capex reserve as a percentage of gross rent per unit (commonly cited around 8–12%; treat as a starting point, not a fixed rule) rather than carrying over a flat dollar figure from a different property.
Comparing cap rate without comparing per-unit debt. Two properties can share an identical cap rate and produce very different cash-on-cash returns once financed, because DSCR and leverage per unit move independently of NOI. Calculate both.

People Also Ask
“Per door” is investor shorthand for “per unit.” A “$170,000 per door” fourplex means the total purchase price divided by four units equals $170,000 per unit — it’s used to compare properties of different sizes on equal footing.
Properties with 1–4 units generally qualify for residential financing, including conventional loans and, for owner-occupants, FHA loans. Five or more units require commercial multifamily financing, which uses different underwriting (including DSCR-based qualification) and terms.
There’s no single “good” cap rate — it depends on the market, property class, and prevailing interest rates. Investors typically compare a property’s cap rate against similar properties in the same submarket rather than a fixed national benchmark.
Neither is universally better. A duplex generally has a lower entry price and simpler management, but a single vacancy removes half the income. A fourplex spreads vacancy risk across more units and often shows lower price per door, but carries a higher total purchase price and more units to manage. See the worked example above.
It’s an FHA underwriting rule applied only to 3- and 4-unit properties, requiring that 75% of the appraised market rent for all units combined equal or exceed the total monthly mortgage payment (PITI). Duplexes are exempt.
NOI equals gross rental income minus operating expenses, excluding debt service (mortgage principal and interest). It’s the standard measure lenders and appraisers use to evaluate a property’s operating performance independent of how it’s financed.
More Explore: https://calclandlord.com/hidden-rental-property-expenses-profit-margins/
How FHA Financing Rules Intersect With Per-Unit Economics
If you’re financing a 3- or 4-unit property with an FHA loan as an owner-occupant, per-unit economics isn’t only an investment-analysis exercise — it can determine loan eligibility.
FHA applies a self-sufficiency test specifically to 3- and 4-unit properties (it does not apply to duplexes). Under this rule, 75% of the appraiser’s estimated market rent for all units combined must be equal to or greater than the total monthly mortgage payment (PITI: principal, interest, taxes, and insurance):
Eligible Rental Income = Total Appraised Market Rent × 0.75
Test: Eligible Rental Income ≥ Monthly PITI
A triplex or fourplex with weak per-unit rent relative to its price can fail this test even when the buyer’s personal income and credit easily qualify. HUD program rules can be updated, so confirm current self-sufficiency test requirements directly with your lender or HUD’s current Single Family Housing Policy Handbook before relying on this for a specific transaction.
People Also Ask
There’s no fixed universal figure — it depends on local rents and expense levels. Compare NOI per unit across several comparable properties in the same submarket rather than targeting a specific dollar benchmark.
Use both together. Price per door shows acquisition cost efficiency; cap rate shows whether that price is supported by the income the property actually produces.
Neither is universally better. It depends on the specific market and deal. Fourplexes often show a lower price per door and, at similar leverage, can produce a higher cash-on-cash return because less debt is carried per unit relative to income — but as the worked example above shows, this isn’t guaranteed and depends on actual rent and financing terms.
A 35–45% operating expense ratio of gross rental income is a commonly cited starting benchmark for small multifamily property — treat it as a rule of thumb to refine, not a fixed number, and adjust for property age, self-management versus professional management, and utility structure.
No — it applies only to FHA-financed 3- and 4-unit properties. Duplexes are exempt from this specific test, though standard debt-to-income and appraisal requirements still apply.
Key Takeaways
Per-unit economics gives you a way to compare small multifamily properties of different sizes on equal footing instead of comparing raw total dollars. Price per door and NOI per unit tell two different stories — one about acquisition efficiency, one about operating performance — and they don’t always point the same direction. Cash flow per unit, which reflects your actual financing terms, is often the deciding factor between two properties that look similar on an unlevered basis. Run your specific numbers — real rents, real expenses, your actual lender quote — through CalcLandlord’s Unit Economics Calculator before comparing properties, and pair it with the cap rate and cash-on-cash return guides for the full picture of a deal’s return profile.
Run your own numbers before you make an offer.
Enter your price, rents, expenses and loan terms — get price per door, NOI per unit, and cash flow per unit instantly.
Try the Unit Economics Calculator
Pingback: Rental Yields by State: The Comparison Investors Miss
Pingback: Selling a Rental? Here's How to Defer the Tax Bill