

How to Use a Market Comparison Tool to Evaluate Rental Yields Across States
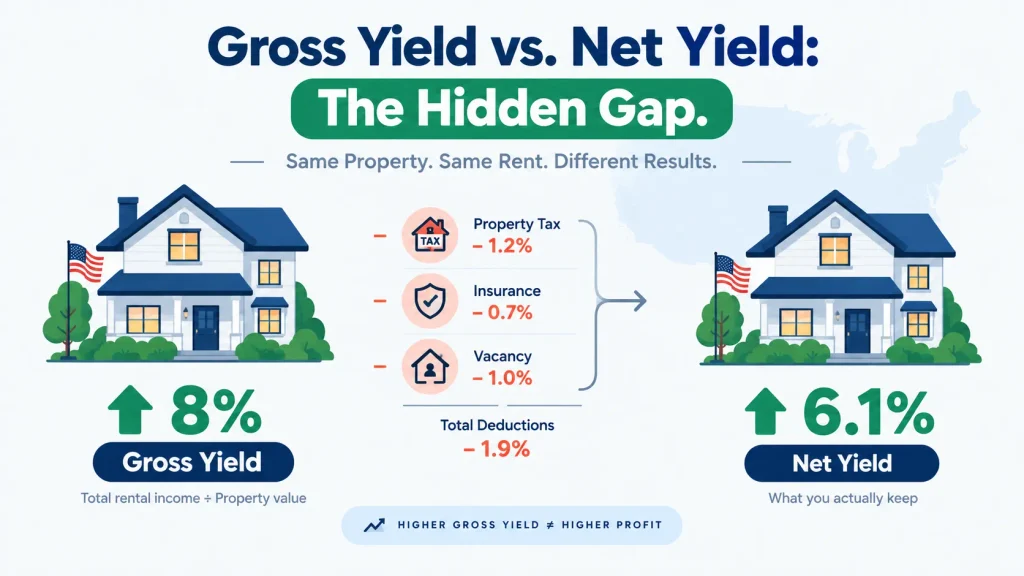
Two properties. Same price. Same rent. Same 8% “yield” on paper. One nets you 7.5% after taxes. The other nets 6.1%. Same numbers, different states — and if you were ranking these two markets by gross yield alone, you’d have picked the worse deal without ever knowing it.
This is the single most common mistake in state-to-state rental comparisons: treating gross yield as the final answer instead of the starting point. Property tax rates alone swing by 6x across the country. Add vacancy and insurance, and a “hot” market on a listing site can quietly underperform a boring one.
Here’s how to actually compare them.
If you’re trying to decide whether to buy your next rental in Ohio or California, “rental yield” is the fastest gut-check you have — but only if you’re comparing it correctly. Most investors get this wrong in one of two ways: they compare gross yield in one state to net yield in another, or they pull rent and price numbers from two different points in time and call it a comparison.
This guide walks through how to actually use a market comparison tool the right way: which numbers to pull, where to get ones you can trust, how to adjust for property taxes and vacancy, and how to avoid the mistakes that make a “13% yield” listing fall apart the moment you own it.

Quick Answer
To compare rental yields across states, pull the same two inputs for every market — median rent and median home value, from the same source and the same time period — then calculate gross yield as (annual rent ÷ home value) × 100. Don’t stop there: subtract each state’s property tax rate, typical insurance costs, and a realistic vacancy allowance to get net yield, since a 7% gross yield in a high-tax state can net less than a 5% gross yield in a low-tax one.
Gross Yield vs. Net Yield vs. Cap Rate
These three terms get used interchangeably in listings and calculators, and that’s where most bad comparisons start.
- Gross yield — annual rent divided by property value, before any expenses. Good for a first-pass screen across many markets at once.
- Net yield — annual rent minus operating expenses (property tax, insurance, maintenance, vacancy, management), divided by property value. This is the number that actually reflects what you’d keep.
- Cap rate — conceptually close to net yield but calculated on net operating income and typically used for valuing a specific property or underwriting a loan, not for screening whole states.
For state-level comparisons, use gross yield to build your shortlist, then switch to net yield once you’re down to a handful of candidates.
The Formula
Gross Rental Yield = (Annual Rent ÷ Property Value) × 100
Net Rental Yield = [(Annual Rent − Annual Operating Expenses) ÷ Property Value] × 100
| Variable | What It Means | Where to Get It |
| Annual Rent | 12 × monthly rent for a comparable unit | Local listings, rent comp tools, or HUD Fair Market Rent as a benchmark |
| Property Value | Purchase price, or current market value for an owned property | Purchase agreement or a home value index (e.g., Zillow ZHVI) |
| Property Tax | Annual tax bill | County assessor, or your state’s effective tax rate applied to value |
| Insurance | Annual landlord policy premium | Insurance quote — varies heavily by state (Florida and coastal states run much higher) |
| Vacancy Allowance | Expected months vacant per year, converted to a % of rent | Local vacancy rate (Census Bureau Housing Vacancy Survey) or a conservative 5–8% default |
| Maintenance/Management | Ongoing upkeep + management fee, if applicable | Typically 8–12% of rent for management alone |
Step-by-Step: Comparing Yields Across States
Step 1 — Fix Your Property Type
State-level home value data blends single-family homes, condos, and multifamily. Decide upfront whether you’re evaluating a 2BR single-family rental, a condo, or a small multifamily — mixing types across states you’re comparing will skew the numbers before you’ve done anything else.
Step 2 — Pull Rent and Value From the Same Source and Time Period
The most common comparison error is grabbing rent from one site and home value from another, months apart. Use a matched pair:
- Rent: HUD’s Fair Market Rent (FMR), published annually every October 1 and based on Census American Community Survey data, is a consistent, publicly documented benchmark you can pull for any county or metro. It represents roughly the 40th percentile of gross rents, which makes it a reasonable stand-in for “typical,” not luxury, rent.
- Home value: A home value index like Zillow’s ZHVI, pulled for the same metro and month.
Both should reflect the same geography (don’t compare a whole state’s home value against one metro’s rent) and the same time window.
Step 3 — Calculate Gross Yield for Each Market
Run the formula above for every state or metro on your shortlist. At this stage you’re just screening — don’t adjust for expenses yet.
Step 4 — Adjust for Property Tax Before You Rank Anything
This is the step most comparison tools skip, and it’s the one that changes rankings the most. Effective property tax rates vary by roughly 6x across the country — from under 0.3% of home value in the lowest-tax states to close to 1.9% in the highest (New Jersey and Illinois currently sit at the top of that range, per Tax Foundation data). A market with a 6% gross yield and a 1.8% tax rate can net less than a market with a 5% gross yield and a 0.5% tax rate.
Step 5 — Layer in Vacancy and Insurance
Pull the local rental vacancy rate from the Census Bureau’s Housing Vacancy Survey rather than assuming a flat number everywhere. A market showing an unusually high gross yield alongside an unusually high vacancy rate is often pricing in turnover risk, not free money. Insurance is the other regional wildcard — coastal and hurricane- or wildfire-exposed states typically carry meaningfully higher landlord insurance premiums than interior states, which erodes net yield further.
Step 6 — Validate With Local Comps, Not Just State Averages
State averages hide enormous local variation. Once you’ve narrowed to 3–5 states, drop down to metro- or neighborhood-level rent comps (Rentometer, Zillow Rental Manager, or a local property manager’s comp report) to confirm your target property type actually rents near the figure you used at the state level.
Worked Example
Say you’re comparing two hypothetical purchases at the same $300,000 price point, both renting for $2,000/month ($24,000/year):
Gross yield for both: ($24,000 ÷ $300,000) × 100 = 8.0%
Now apply each state’s approximate effective property tax rate (Tax Foundation data):
| Lower-Tax State (~0.5% rate) | Higher-Tax State (~1.9% rate) | |
| Annual property tax | $1,500 | $5,700 |
| Rent remaining after tax | $22,500 | $18,300 |
| Approx. yield after tax alone | 7.5% | 6.1% |
Identical gross yield, meaningfully different outcome — and that’s before insurance, vacancy, and maintenance are even factored in. This is why ranking states by gross yield alone routinely misleads investors comparing, say, a Sun Belt no-income-tax state against a Northeast high-property-tax state.
National Benchmark, for Context
As of Q2 2026, the average gross rental yield across the U.S. sits at roughly 6.7%, according to Global Property Guide’s quarterly tracking — up modestly from about 6.6% at the end of 2025. Treat this as a sanity check, not a target: a specific property well below this average in its local market may be overpriced or under-rented; one well above it may be signaling elevated risk rather than a bargain, especially in markets with above-average vacancy.
Common Mistakes When Comparing Yields Across States
Using gross yield alone. As shown above, ignoring property tax can flip a ranking entirely. Always get to net yield before making a decision, even a rough one.
Mixing property types. A state’s blended home-value index includes condos, single-family homes, and multifamily. If you’re buying single-family, compare single-family-specific data where you can — a statewide average that leans condo-heavy (or vice versa) will distort the comparison.
Ignoring vacancy and management costs. Even well-run rentals see vacancy between tenants, and management typically runs 8–12% of rent if you’re not self-managing. A yield that looks strong on paper before these costs can look ordinary after them.
Chasing the highest number without checking why it’s high. An unusually high yield in a declining or high-vacancy market often reflects risk — deferred maintenance, weak tenant demand, or price stagnation — not an overlooked opportunity. Cross-check any standout yield against local vacancy rates and price trends before acting on it.
From Yield Comparison to a Decision
Yield tells you where the income is strongest — it doesn’t tell you the whole strategy. If your goal is current cash flow, you’re generally looking for higher net yields, which tend to cluster in lower-cost, lower-property-tax metros. If your goal is long-term appreciation, you may reasonably accept a lower yield in a high-cost coastal market in exchange for stronger historical price growth — that’s a legitimate trade-off, not a mistake, as long as you’re making it deliberately rather than by accident.
Once you’ve narrowed to a shortlist using the steps above, run the actual numbers for a specific property through a cash-on-cash return and cap rate calculator rather than relying on state-level averages for your final decision — averages are a screening tool, not an underwriting tool.
People Also Ask
There’s no single universal cutoff, but as a rough guide: yields meaningfully below the national average (currently around 6–7% gross) often signal an appreciation-focused market, while yields well above it are worth cross-checking against local vacancy and price trends before assuming they’re simply a good deal.
Use purchase price when deciding whether to buy — it reflects your actual cost basis. Use current market value when evaluating how a property you already own is performing, since a property that’s appreciated will show a lower yield on current value than it did at purchase.
No. A high gross yield can reflect either genuine cash-flow strength or elevated risk (high vacancy, declining neighborhood, deferred maintenance). Always verify local vacancy rates and rent-growth trends before treating a high yield as a green light.
For rent, HUD’s Fair Market Rent database (huduser.gov) is publicly documented and updated annually. For home values, a published home value index gives you a consistent, dated figure. For vacancy, the Census Bureau’s Housing Vacancy Survey is the standard public source. The Tax Foundation tracks and publishes property tax rates by state annually.
Net yield is the more practical metric for cross-state screening since it’s simpler to calculate from public data. Cap rate is better reserved for evaluating a specific property’s income relative to its financing and operating structure once you’ve picked a market.
A note on the numbers above:
Rental yield inputs — rent levels, home values, tax rates — change regularly and vary widely even within a single state. The figures cited here (national average yield, property tax rate ranges) are directional benchmarks from HUD, the Census Bureau, the Tax Foundation, and Global Property Guide’s published tracking, current as of mid-2026. Confirm current figures for your specific state and county before making a purchase decision, and note that property tax assessment rules (like non-owner-occupied surcharges in some states) can differ from the general effective rate.
