

How to Estimate Rental Property Fair Market Value Using Verified NOI and Local Cap Rates
Here’s an uncomfortable truth: the fair market value number sitting in your spreadsheet is probably wrong — not because your math is bad, but because your inputs are. Plug a seller’s rosy NOI into a national-average cap rate, and you can end up overpaying by tens of thousands of dollars without ever knowing it. The formula itself is simple — NOI ÷ Cap Rate. The skill is in verifying every number that feeds it. This guide shows you exactly how appraisers, lenders, and experienced investors build a defensible value — with a full worked example, so you can do it too.
If you’ve ever plugged a property’s numbers into an online calculator and gotten a value that felt “off,” you already know the problem with most fair market value estimates: they’re only as good as the NOI behind them. Garbage in, garbage out.
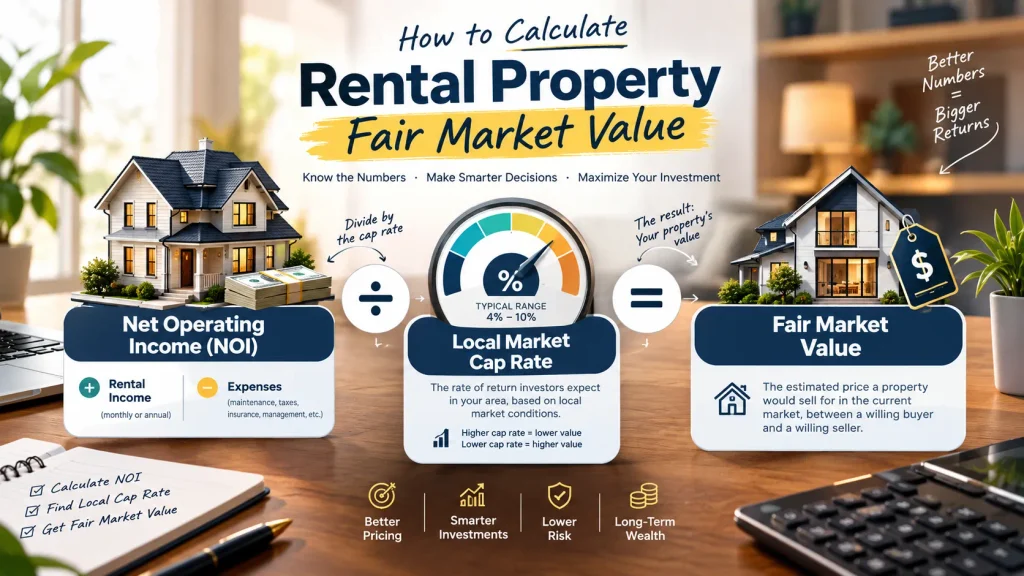
Quick answer: Fair market value (FMV) for an income property is calculated as Stabilized Net Operating Income ÷ Market Cap Rate. The catch is in those two words — stabilized and market. Most investors either use the seller’s unverified NOI or a cap rate pulled from a national average, and both mistakes can throw the value off by tens of thousands of dollars. This guide walks through how to build a verified NOI, source a cap rate that actually reflects your local market, and turn the two into a defensible FMV.
This isn’t a formal appraisal, and it won’t replace one for a loan or a legal matter. But it’s the same method appraisers, lenders, and experienced investors use to sanity-check a number before they act on it.
Why the Income Approach Is How Investors Value Rental Property
There are three classic ways to value real estate: the sales comparison approach (what similar properties sold for), the cost approach (what it would cost to rebuild), and the income approach (what the income stream is worth to an investor).
For a single-family rental, the sales comparison approach usually carries the most weight, because buyers are often owner-occupants who don’t think in terms of NOI. But for duplexes, small multifamily, and anything bought primarily for cash flow, the income approach tends to dominate — because that’s how the buyer pool actually prices the deal. Comparable sales are still useful as a sanity check, not as the whole story.
Fair market value, appraised value, and listing price are not the same thing. Fair market value is what a willing buyer and willing seller would agree on, with neither under pressure and both reasonably informed. Appraised value is one licensed professional’s opinion, often shaped by a specific purpose (like a loan). Listing price is just what the seller is asking. This guide is aimed at estimating the first one.
Step 1: Build a Verified Net Operating Income (NOI)
NOI drives the whole calculation, and it’s also where most FMV estimates go wrong. The formula is simple:
NOI = Effective Gross Income − Operating Expenses
The difficulty isn’t the formula. It’s making sure every number that feeds into it reflects reality, not a seller’s best-case pitch.
Start With Gross Potential Income
This is the total rent the property would generate if every unit were occupied at true market rent, all year. “True market rent” means what a new tenant would actually pay today — not necessarily what a long-term tenant is currently paying under an old lease. Compare current in-place rents against active listings for similar units nearby, and don’t be surprised if there’s a gap in either direction.
Subtract Vacancy and Credit Loss
No property runs at 100% occupancy forever, and even good tenants occasionally pay late or not at all. A vacancy and credit loss allowance accounts for this. The right percentage varies a lot by property class, submarket, and tenant type, so instead of leaning on a generic national figure, look at the property’s own leasing history over the last two to three years and compare it to what local property managers are reporting for similar assets. If a seller is showing 0% vacancy on a stabilized property, treat that as a red flag rather than good news.
Add Other Income, Conservatively
Parking fees, laundry, pet rent, application fees, and late fees can all add to income, but they should be based on actual collected amounts, not aspirational policy. If a seller’s pro forma assumes rent for parking spots that have never been rented, leave that income out.
Subtract Operating Expenses — Line by Line
This is the section that deserves the most scrutiny. A defensible expense list typically includes:
- Property taxes — Use the post-sale reassessed amount where applicable, not the seller’s current (often lower) bill. Many counties reassess property tax based on the new sale price.
- Insurance — Get an actual quote for the specific property rather than reusing the seller’s old policy, especially in markets where premiums have moved a lot in recent years.
- Property management — Include a market-rate management fee even if you plan to self-manage. Your time has a cost, and leaving this out inflates NOI artificially.
- Repairs and maintenance — Should scale with the age and condition of the property, not a flat percentage pulled out of the air.
- Utilities, landscaping, HOA dues, and administrative costs — Whatever the owner actually pays, based on utility bills and HOA statements, not estimates.
Common red flags when reviewing a seller’s NOI:
| Red Flag | Why It Matters |
| 0% vacancy assumed | No stabilized rental runs at full occupancy indefinitely |
| Seller’s current (pre-sale) tax bill used | Taxes are often reassessed after a sale, sometimes significantly |
| No management fee included, even for owner-managed properties | Understates the true cost of operating the asset |
| Expense ratio well below typical range for the property type | Suggests missing or underestimated line items |
| Capital expenditures mixed into “repairs” | Confuses one-time capital costs with recurring operating costs |
Where Capital Reserves Belong
Reserves for big-ticket items — a roof, HVAC systems, major renovations — are a real cost of ownership, but they’re not always included in NOI for the purpose of calculating value, because appraisers and investors don’t treat them consistently. The important thing is to be clear about which convention you’re using and apply it consistently when you compare properties or reconcile against comps. Many investors track reserves separately, below the NOI line, so they don’t distort the cap rate calculation but still show up in a true cash-flow picture.
Step 2: Source a Local Cap Rate — Not a National Average
Once you have a defensible NOI, the second half of the formula is the cap rate. This is where a lot of DIY valuations fall apart, because it’s tempting to grab whatever number shows up first in a Google search and apply it everywhere.
A cap rate reflects the return investors expect for taking on the risk of a specific type of property in a specific market, not a universal constant. A cap rate that makes sense for a Class A apartment building in a low-risk metro will understate the yield investors expect for a Class C property in a higher-risk submarket, and vice versa.
Where to Find Real Cap Rate Data
- Paid commercial data platforms (such as CoStar, Reonomy, or Crexi) aggregate recent sales with reported income, which lets you see actual cap rates transacting in your market.
- Local commercial brokers who work in investment sales often publish market reports or can share recent comparable transactions.
- Public records can be used to back into a cap rate yourself: find a recent comparable sale, estimate its NOI from rent rolls or public listing data, and divide NOI by the sale price.
- Local investor networks and property management companies often have a feel for where cap rates are trading, even without formal data subscriptions.
Because cap rates move with interest rates, local supply and demand, and investor sentiment, treat any number more than a few months old with some caution, and always cross-check more than one source rather than relying on a single data point.

Adjusting for Property-Specific Risk
Even within the same city, cap rates vary by property class (A, B, or C), building age, tenant quality, lease terms, and submarket. A Newer Property with long-term, creditworthy tenants in a strong location will generally trade at a lower cap rate (higher value per dollar of NOI) than an older property with month-to-month tenants in a weaker location. When you’re building your own estimate, start from a verified local comp and adjust up or down based on how the subject property compares on these factors — rather than applying one flat number across very different assets.
Step 3: Calculate Fair Market Value
With a verified NOI and a defensible local cap rate, the calculation itself is straightforward:
Fair Market Value = Stabilized NOI ÷ Market Cap Rate
Worked Example: 4-Unit Multifamily Property
Here’s a simplified, illustrative example using round numbers to show how the pieces fit together. (Replace these figures with your own verified numbers and current local cap rate data — don’t treat these as market benchmarks.)
| Line Item | Annual Amount |
| Gross Potential Rent (4 units) | $84,000 |
| Vacancy & Credit Loss (based on property history) | −$5,040 |
| Other Income (laundry, pet rent) | +$1,800 |
| Effective Gross Income | $80,760 |
| Property Taxes | −$7,200 |
| Insurance | −$3,600 |
| Property Management (8%) | −$6,461 |
| Repairs & Maintenance | −$4,000 |
| Utilities (owner-paid) | −$2,400 |
| Landscaping & Admin | −$1,200 |
| Total Operating Expenses | −$24,861 |
| Net Operating Income (NOI) | $55,899 |
If verified local data supports a cap rate of, say, 6.0% for a comparable property in that submarket:
FMV = $55,899 ÷ 0.06 = $931,650
Sensitivity Check
Because the cap rate has such a large effect on value, it’s worth seeing how sensitive your number is to a small change in the rate:
| Cap Rate | Estimated FMV |
| 5.0% | $1,117,980 |
| 5.5% | $1,016,345 |
| 6.0% | $931,650 |
| 6.5% | $860,000 |
| 7.0% | $798,557 |
A half-point swing in cap rate can move value by six figures on a property like this, which is exactly why sourcing a defensible, current, local cap rate matters more than getting a slightly more precise NOI.
Sanity Checks
Before you settle on a number, run it against two quick cross-checks:
- Gross Rent Multiplier (GRM): Sale Price ÷ Gross Annual Rent. Compare your estimated value’s implied GRM to recent local comps — if it’s wildly out of range, revisit your assumptions.
- Cost Approach as a ceiling: For most existing properties, your income-approach value shouldn’t dramatically exceed what it would cost to buy land and rebuild the structure today. If it does, something in the NOI or cap rate is likely off.
Step 4: Reconcile With Comparable Sales
Once you have an income-approach value, compare it to what similar properties have actually sold for recently. If the two numbers are close, that’s a good sign your inputs are sound. If they diverge significantly, dig into why — it could mean the comps aren’t as comparable as they look, or it could mean your NOI or cap rate assumptions need another look. Appraisers reconcile multiple approaches rather than relying on just one, and it’s worth doing the same, even informally.
Special Cases Worth Knowing
- Converting a primary residence to a rental: Your depreciation basis is generally the lesser of your adjusted cost basis or the property’s fair market value at the time it’s converted to rental use. This is a tax question with real consequences, so confirm the specifics with a CPA and IRS Publication 527 rather than relying on a general guide.
- Value-add properties: If you’re underwriting a property you plan to renovate, be careful not to apply a stabilized market cap rate to today’s unstabilized NOI — that overstates current value. Model the “as-is” value separately from the post-renovation “stabilized” value.
- Lease-up or newly built properties: When a property hasn’t reached stable occupancy yet, a discounted cash flow (DCF) approach — projecting income year by year until stabilization — is often more accurate than a single direct capitalization calculation.
- Short-term rentals: These typically carry higher effective vacancy, higher management costs, and more income volatility than long-term rentals, which should be reflected honestly in both the NOI and the cap rate you apply.
How Lenders Look at Your Number
If you’re financing the purchase, your lender will look at the property through the lens of debt service coverage ratio (DSCR) — essentially, does the NOI comfortably cover the mortgage payment. Lenders typically want to see NOI exceed the annual debt service by a meaningful margin, and they’ll often have their own appraisal completed under USPAP (Uniform Standards of Professional Appraisal Practice) guidelines rather than relying on your estimate. Understanding this ahead of time helps you avoid overpaying for a deal that won’t appraise or won’t cash-flow enough to qualify for financing.
Explore More: https://calclandlord.com/brrrr-strategy/

Common Mistakes That Distort Fair Market Value
- Using the seller’s NOI without verifying a single line item. Sellers have an incentive to present the best possible number.
- Applying a cap rate from a different market or property class. A cap rate for suburban Class B apartments 500 miles away tells you little about a Class C fourplex in your target neighborhood.
- Ignoring likely tax reassessment or rising insurance costs after purchase. Using pre-sale figures can understate your real future expenses.
- Leaving capital reserves out of your thinking entirely, even if you exclude them from the NOI calculation itself.
- Confusing NOI with cash flow. NOI is calculated before debt service (your mortgage payment). It tells you what the property earns, not what lands in your pocket after financing costs.
People Also Ask
Fair market value is a theoretical price a willing buyer and seller would agree on with full information and no undue pressure. Appraised value is one licensed appraiser’s formal opinion, usually prepared for a specific purpose like a mortgage, and it may lean conservative because of that purpose.
Yes, for your own decision-making — this is exactly what the NOI-and-cap-rate method is for. However, lenders, courts, and the IRS generally require a licensed appraisal for financing, legal disputes, or certain tax situations.:
Almost always because they’re using different NOI assumptions or different cap rates. Small differences in vacancy percentage, expense ratios, or which cap rate source is used can produce meaningfully different results — which is exactly why verifying your inputs matters more than the calculator itself.:
A lower cap rate produces a higher value for the same NOI, so sellers generally want the lowest defensible cap rate applied, while buyers want the highest defensible one. This is normal, healthy tension in a negotiation — it’s also why sourcing your own independent cap rate data matters.
No. NOI is calculated before debt service. Mortgage principal and interest come out of NOI to arrive at actual cash flow, which is a separate calculation from fair market value.
Put It Into Practice
Once you’ve verified your NOI and sourced a defensible local cap rate, you can run the full calculation — along with a cap rate sensitivity table — using Calclandlord’s Cap Rate Calculator and Rental Property NOI Calculator. Pair those with the Cash-on-Cash Return Calculator to see how the deal performs after financing, and the Rental Property Cash Flow Calculator for your month-to-month picture. If you’re weighing this purchase against a 1031 exchange or evaluating depreciation on a converted primary residence, our guides on 1031 Exchange and Rental Property Depreciation walk through those next steps.
Tax and legal rules referenced here — including depreciation basis and reassessment practices — vary by state and situation. This article is educational and isn’t a substitute for advice from a CPA, real estate attorney, or licensed appraiser.
Conclusion
Estimating a rental property’s fair market value isn’t about finding a magic number — it’s about trusting the number you land on. The formula itself (NOI ÷ Cap Rate) takes seconds to calculate. What actually separates a reliable estimate from a guess is the work behind it: verifying every line of income and expense instead of accepting the seller’s pro forma, and sourcing a cap rate that reflects your specific market and property class instead of a generic average.
Get those two inputs right, cross-check the result against Comparable sales, and you’ll have a defensible value you can act on with confidence — whether you’re making an offer, refinancing, or deciding whether a deal actually pencils out. When the stakes are high enough (financing, a legal dispute, or a major purchase), pair this method with a licensed appraiser’s opinion rather than relying on it alone.

Pingback: The Landlord Tax Mistake Costing You $10K+ a Year
Pingback: The Real Cost of Evicting a Tenant (It's Not $250)