
STR Calculator: How to Actually Calculate Short-Term Rental Revenue, Cash Flow, and ROI
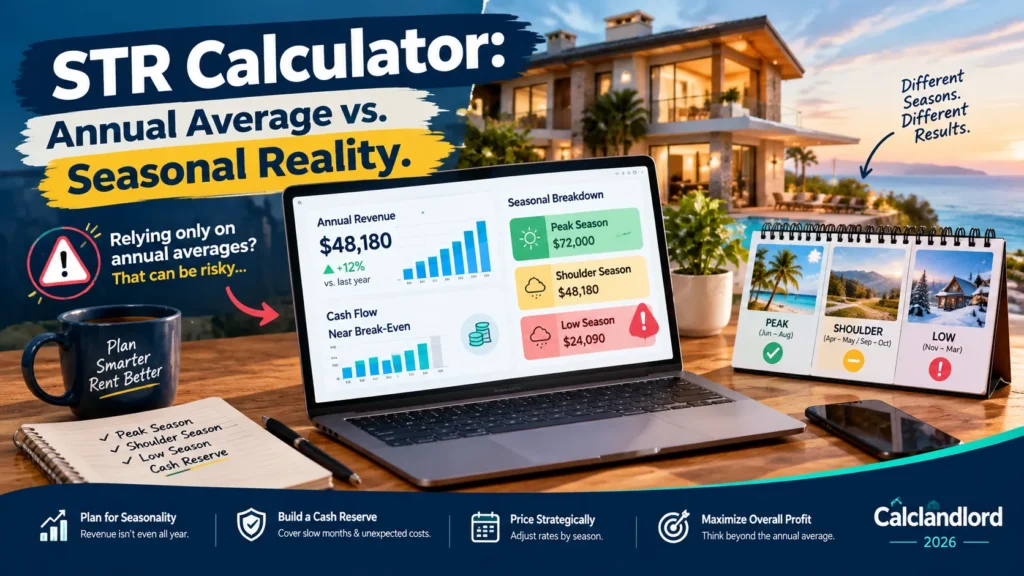
Most STR calculators tell you how much revenue a property could make. Almost none tell you the occupancy rate you’d need just to break even — and that’s the number that actually decides whether a deal is safe or a slow-motion loss. This guide walks through how a real STR calculator works: estimating ADR and occupancy from actual comps, building out every operating expense, and calculating NOI, cap rate, cash-on-cash return, and break-even occupancy correctly. You’ll also see a full worked example comparing a blended annual average against a seasonal model — and why the gap between them matters more than either number alone.
Most “STR calculator” tools you’ll find online do one of two things well and everything else badly. Either they’re a slick revenue estimator that tells you nothing about expenses, financing, or risk — or they’re a spreadsheet-style form that spits out a number without explaining where it came from.
Neither approach tells you what you actually need to know before you put an offer on a short-term rental: will this property make money after every real cost is accounted for, and how much cushion do you have if it underperforms?
This guide walks through exactly what a short-term rental calculator should measure, the formulas behind every metric, and a full worked example so you can run the math yourself — with or without a calculator tool.
What Is an STR Calculator?
An STR (short-term rental) calculator is a financial modeling tool that estimates a vacation-rental or Airbnb-style property’s income, expenses, and return on investment before you buy it — or to evaluate a property you already own.
At minimum, it should model:
- Revenue — based on average daily rate (ADR) and occupancy
- Operating expenses — both fixed and variable
- Financing costs — mortgage principal, interest, taxes, and insurance
- Return metrics — cap rate, cash-on-cash return, and break-even occupancy
A calculator that only produces a single “you’ll make $X per month” figure without showing its assumptions isn’t giving you an investment analysis — it’s giving you a guess with a nice interface.
Who Actually Needs This
- First-time STR buyers deciding whether a specific property pencils out
- Existing hosts trying to understand why a “profitable” listing isn’t generating real cash flow
- Landlords converting a long-term rental to short-term who need to compare the two models directly
- Property managers and rental-arbitrage operators underwriting deals for clients or themselves
What It Can’t Tell You
A calculator only outputs as well as the assumptions you feed it. It can’t verify local STR legality, predict a recession in the travel market, or account for a property manager who does a poor job. Treat every output as an estimate range, not a guarantee — and always run a downside scenario, which we’ll cover below.
How to Calculate Short-Term Rental Revenue
The foundation of every STR calculation is one formula:
Gross Revenue = ADR × Booked Nights
And booked nights come from:
Booked Nights = Available Nights × Occupancy Rate
So for a property available 365 nights a year at a 60% occupancy rate and a $220 ADR:
- Booked nights = 365 × 0.60 = 219 nights
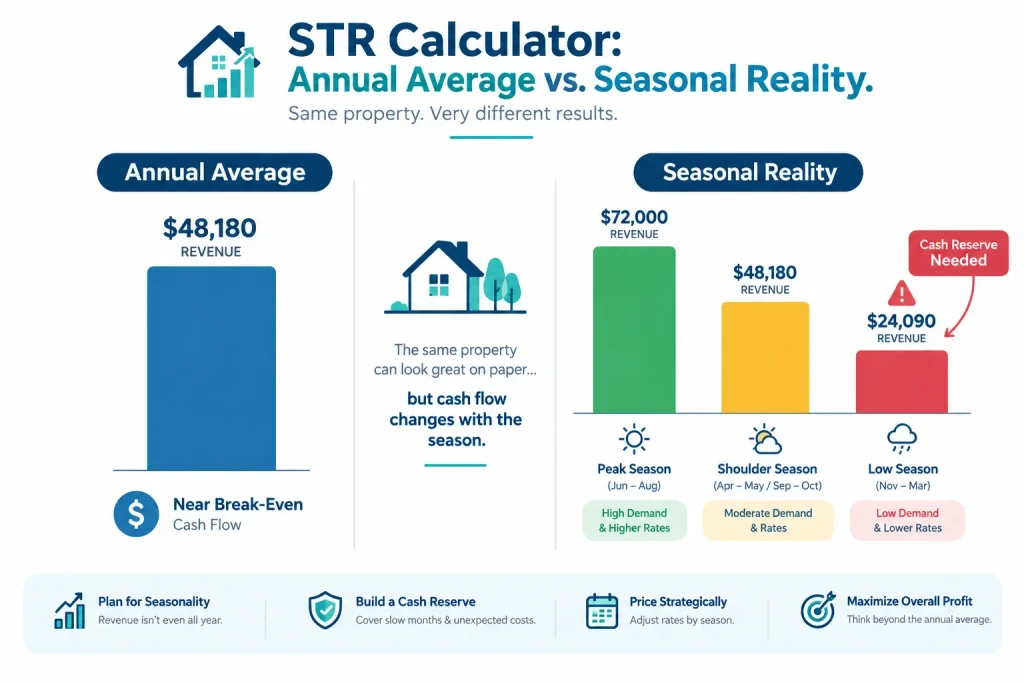
- Gross revenue = $220 × 219 = $48,180/year
That single annual number is a starting point — not the answer. Two things distort it if you stop there:
1. Cleaning fees and pass-through charges aren’t operating income. If you charge a $150 cleaning fee and pay a cleaner $140, that $150 shouldn’t be counted the same as ADR revenue — it’s mostly a pass-through, and the real economic benefit is only the $10 spread (if any).
2. A single annual average hides the months that actually make or lose money. A property that does 85% occupancy in July and 25% in February can average to “60% occupancy” — but the cash flow pattern across those months is completely different, which matters for financing reserves. We cover this in the seasonality section below.
How to Estimate ADR and Occupancy Before You Buy
This is where most calculators — and most new investors — get it wrong. Plugging in an ADR you found in a single Airbnb listing or a “typical Airbnb income” statistic from an article isn’t underwriting; it’s guessing with extra steps.
Use Comparable Listings, Not Averages
Pull comps that match on:
- Bedroom and bathroom count
- Location (same neighborhood or submarket, not just “same city”)
- Amenities (pool, hot tub, view, parking)
- Property quality and photo standard
- Review count and rating
Use the Median, Not the Optimistic Average
A handful of high-performing “hero listings” can pull an average ADR upward. Median comps, filtered to properties similar to yours, give a more realistic baseline. CalcLandlord’s Market Comparison tool is built for exactly this — lining up comps side by side instead of relying on one headline number.
Adjust for Seasonality, Not Just an Annual Number
Peak season, shoulder season, and low season should each get their own ADR and occupancy estimate. A ski-town property and a beach property have opposite seasonal curves — modeling them with one blended annual average erases the information you need most.
Discount for a New Listing
A brand-new listing with zero reviews typically underperforms an established comp with 100+ reviews for the first 3–6 months. Build in a ramp-up period rather than assuming full market-rate performance from day one.
The Complete STR Operating Expense Checklist
An STR calculator that only asks for “monthly expenses” as one lump input is not doing the job. Short-term rentals carry more expense categories than a standard long-term rental, and missing any of them is the single biggest reason “profitable on paper” listings lose money in practice.
| Category | Examples |
| Financing & ownership | Mortgage P&I, property tax, insurance, HOA, PMI |
| Guest turnover | Cleaning, laundry, restocking, consumables |
| Ongoing operations | Utilities, internet/streaming, maintenance, pest control, landscaping |
| Management & platforms | Self-management time or co-hosting fee, full-service management (typically 15–30% of revenue), Airbnb/Vrbo host fees, payment processing |
| Software & admin | Dynamic-pricing tools, channel managers, accounting/bookkeeping |
| Licensing & taxes | STR permits, business licenses, lodging/occupancy tax remittance |
| Reserves | Furniture and appliance replacement, HVAC, roof, emergency repair fund |
| Setup (one-time) | Furnishing, staging, professional photography, initial repairs |
For a deeper breakdown of the costs new landlords typically underestimate — on both STR and long-term properties — see CalcLandlord’s Hidden Rental Property Expenses guide.
STR Financing: Modeling Your Mortgage and Debt Service
Financing assumptions change your cash flow more than almost any other input, and they’re where a lot of STR calculators are thinnest.
At minimum, model:
- Down payment (STR/investment financing often requires 20–25%+)
- Interest rate and loan term
- Principal and interest (P&I)
- Property taxes and insurance, whether escrowed or not
- PMI, if applicable
- Closing costs
Debt Service is your total annual mortgage payment (P&I, and taxes/insurance if escrowed). It’s the number that turns NOI into actual cash flow.
If you’re also running the numbers on a refinance-heavy strategy — buying, renovating, and pulling capital back out — CalcLandlord’s BRRRR Strategy pillar goes deeper on appraisal risk and post-refinance rate assumptions, which apply just as much to an STR-BRRRR play as a long-term one.
NOI, Cash Flow, and Profit — What’s the Difference?
Competing STR calculators use “revenue,” “profit,” “NOI,” and “cash flow” almost interchangeably. They are not the same number, and confusing them is how “profitable” listings quietly lose money.
Net Operating Income (NOI)
$$NOI = \text{Gross Revenue} – \text{Operating Expenses (excluding debt service)}$$
Pre-Tax Cash Flow
$$\text{Cash Flow} = NOI – \text{Annual Debt Service}$$
Taxable Income is different again — it factors in depreciation and mortgage interest deductions, which can make your taxable income lower than your actual cash flow. That’s a tax-planning advantage, not extra cash in your pocket, and it’s worth understanding separately (see the taxes section below). CalcLandlord’s Cash Flow Calculator walks through this exact NOI → cash flow chain with your own numbers.
How to Calculate STR ROI, Cap Rate, and Cash-on-Cash Return
These three metrics answer different questions, and a good STR calculator should show all three side by side — not pick one and call it “ROI.”
Cap Rate — how the property performs independent of financing:
$$\text{Cap Rate} = \frac{NOI}{\text{Property Value or Purchase Price}} \times 100$$
Cash-on-Cash Return — how your actual invested cash is performing:
$$\text{Cash-on-Cash Return} = \frac{\text{Annual Pre-Tax Cash Flow}}{\text{Total Cash Invested}} \times 100$$
Simple ROI — a broader return figure, often blending cash flow with appreciation or equity paydown depending on how it’s defined (define it explicitly, since “ROI” alone is ambiguous):
$$\text{ROI} = \frac{\text{Net Annual Profit}}{\text{Total Investment}} \times 100$$
Cap rate is useful for comparing properties as if paid in cash. Cash-on-cash return reflects how leverage is working for you specifically. For a full breakdown of when to use each — including a decision framework for choosing between them — see CalcLandlord’s dedicated Cap Rate and Cash-on-Cash Return pillar articles.
Break-Even Occupancy: The Number That Protects You
Break-even occupancy tells you the minimum occupancy rate needed just to cover your costs — the single most useful “downside protection” number in STR underwriting, and one most calculators skip entirely.
$$\text{Break-Even Occupancy} = \frac{\text{Fixed Costs (incl. debt service)}}{\text{Revenue Capacity at Full Occupancy} – \text{Variable Costs at Full Occupancy}}$$
If your break-even occupancy comes out at 68% and your realistic market occupancy is 60%, that’s a red flag before you buy — not something to discover after closing. Recalculate this figure any time ADR, financing terms, or management fees change materially.
Why Seasonality Wrecks Simple Annual Averages
Two properties can share the same “60% annual occupancy, $220 ADR” headline numbers and have completely different cash flow realities:
- Property A (beach town): 90% occupancy in summer, 30% in winter
- Property B (year-round urban market): steady 55–65% occupancy all year
Property A needs a much larger cash reserve to survive the low season, even though its annual average looks identical to Property B’s. Model revenue month by month, not as one blended figure, and factor in:
- High, shoulder, and low season ADR/occupancy separately
- Owner-use nights and blocked calendar days
- Minimum-stay restrictions during slow periods
- Event- or holiday-driven demand spikes
Scenario and Stress-Test Analysis
Every STR underwrite should include at least three occupancy/ADR scenarios, not one point estimate:
- Conservative — ADR and occupancy 10–15% below your comp-based estimate
- Base case — your realistic comp-based estimate
- Optimistic — a modest upside case, not a best-ever-listing fantasy
Then run a downside stress test layering in: lower occupancy, higher insurance (STR insurance has risen in many markets), one or two “dead” months, and an unplanned repair. If the deal still cash flows — even thinly — in the conservative case, you have a real margin of safety. If it only works in the optimistic case, that’s the calculator telling you something important.
Worked STR Calculator Example
Here’s a single hypothetical single-family STR run through the full model, first as an annual average, then adjusted for seasonality.
Assumptions:
- Purchase price: $400,000
- Down payment: 25% ($100,000)
- Closing costs: $8,000
- Furnishing/setup: $18,000
- Interest rate: 7.0%, 30-year term
- ADR: $220 | Occupancy: 60% | Available nights: 365
Annual-Average Model
| Line Item | Amount |
| Booked nights (365 × 0.60) | 219 |
| Gross revenue ($220 × 219) | $48,180 |
| Management (20%) | -$9,636 |
| Cleaning, utilities, supplies | -$6,200 |
| Insurance & property tax | -$5,400 |
| Maintenance & reserves | -$3,200 |
| NOI | $23,744 |
| Annual debt service (approx., 7%/30yr on $300,000) | -$23,940 |
| Cash Flow | -$196 |
At the blended annual average, this deal is essentially break-even — cash flow neutral, not the profitable-looking $48K gross revenue headline suggests.
Seasonal Model (same property, modeled by season)
| Season | Months | ADR | Occupancy | Revenue |
| Peak | 4 | $290 | 82% | $28,536 |
| Shoulder | 5 | $205 | 55% | $17,269 |
| Low | 3 | $140 | 28% | $3,528 |
| Total | 12 | — | — | $49,333 |
The seasonal total ($49,333) lands close to the annual-average estimate ($48,180) — but the distribution matters: this owner needs enough reserve to cover roughly $2,000–$3,000/month in fixed costs during the 3-month low season with almost no revenue coming in. That’s the risk the annual average hides completely.
Resulting metrics: Cap rate ≈ 5.9% (NOI ÷ $400,000). Cash-on-cash return ≈ -1.6% in year one on the annual model (essentially break-even, cash-negative after closing/setup costs are amortized). Break-even occupancy ≈ 58% — meaning this deal has almost no margin for underperformance at the assumed ADR.
Short-Term Rental vs. Long-Term Rental: Which Wins?
There’s no universal answer — it depends on the market, the property, and your risk tolerance.
| Factor | Short-Term Rental | Long-Term Rental |
| Revenue potential | Higher ceiling | Lower, but stable |
| Expense load | Much higher (turnover, furnishing, management) | Lower and more predictable |
| Management workload | High (or costly to outsource) | Low to moderate |
| Regulatory risk | Higher — zoning/licensing can change | Lower, generally well-established law |
| Income stability | Volatile, seasonal | Steady monthly rent |
| Vacancy exposure | Frequent (nightly turnover) | Rare (annual leases) |
If the STR math only works in your optimistic scenario, it’s worth running the same property through a long-term rental model for comparison before committing to the STR strategy.

STR Regulations, Taxes, and Depreciation Landlords Must Know
This section is general education, not individualized tax or legal advice — STR rules vary significantly by city, county, and state, and change frequently.
- Verify local legality first. Many cities cap the number of STR permits, restrict them to owner-occupied properties, or ban them in certain zones entirely. Confirm with your local zoning authority and HOA before underwriting the deal.
- Lodging and occupancy taxes typically apply on top of income tax and are sometimes collected automatically by the platform — confirm what’s remitted for you versus what you owe directly.
- Depreciation works similarly to other rental real estate: residential property is generally depreciated over 27.5 years (consult current IRS guidance, since rules and personal-use thresholds can affect this). CalcLandlord’s Rental Property Depreciation pillar covers the full MACRS calculation.
- Passive activity rules can differ for STRs depending on average guest stay length and your level of material participation — this is a common area where a tax professional’s input changes the outcome materially.
- Depreciation recapture and capital gains apply at sale, same as any investment property.
Given how much variation exists state to state, verify current rules with the IRS, your state’s tax authority, and a licensed tax professional before finalizing any purchase decision.
Common STR Calculator Mistakes (and How to Avoid Them)
- Using a single “typical Airbnb income” figure instead of comps matched on bedrooms, location, and quality
- Counting cleaning fees as pure profit instead of a mostly pass-through cost
- Ignoring seasonality and using one blended annual occupancy number
- Skipping break-even occupancy — the number that tells you your actual margin for error
- Underestimating reserves for furniture, appliances, and major repairs unique to high-turnover STR use
- Forgetting owner-use nights if you plan to personally use the property part of the year
- Not stress-testing the deal against a lower-occupancy, higher-expense scenario before buying
People Also Ask
There’s no universal benchmark — it depends heavily on financing, market, and property type. A cash-on-cash return in the high single digits to low double digits is often considered solid for a leveraged STR, but always weigh it against the deal’s break-even occupancy and downside scenario, not just the headline number.
It depends entirely on ADR, occupancy, and expenses for that specific property and market — not a national average. Run comps-based ADR and occupancy through the full expense model above rather than relying on a single “average Airbnb income” statistic.
Use median occupancy from comparable listings (same bedroom count, location, and quality tier), adjusted for seasonality — not an optimistic top-performer’s occupancy rate.
Profitability depends on market saturation, local regulation, financing costs, and how carefully expenses are modeled — it varies significantly by market and cannot be answered as a single yes/no for every property.
Only the portion that exceeds what you pay a cleaner. Treating the full cleaning fee as profit overstates your real revenue.
Conclusion
A real STR calculator does more than spit out a revenue estimate — it forces you to confront expenses, financing, seasonality, and break-even occupancy before you’re locked into a deal. Run the numbers conservatively, stress-test the downside, and let the math — not the listing photos — decide whether a short-term rental belongs in your portfolio.
