

What Is Cap Rate Explained for Landlords?
If your “9% return” rental is really earning 4% after expenses, you’re not underperforming—you’re miscalculating. Cap rate is the single most-used metric to compare rental properties, estimate fair value, and negotiate price, yet most landlords get it wrong by mixing in mortgage payments, ignoring vacancy, or using gross rent instead of NOI. In this guide, you’ll learn the exact cap rate formula, how to calculate it step by step with real 2026 examples, what counts as a good cap rate by market, and the seven mistakes that silently destroy returns. By the end, you’ll be able to screen deals faster, justify offers with data, and stop overpaying for cash flow that isn’t really there.
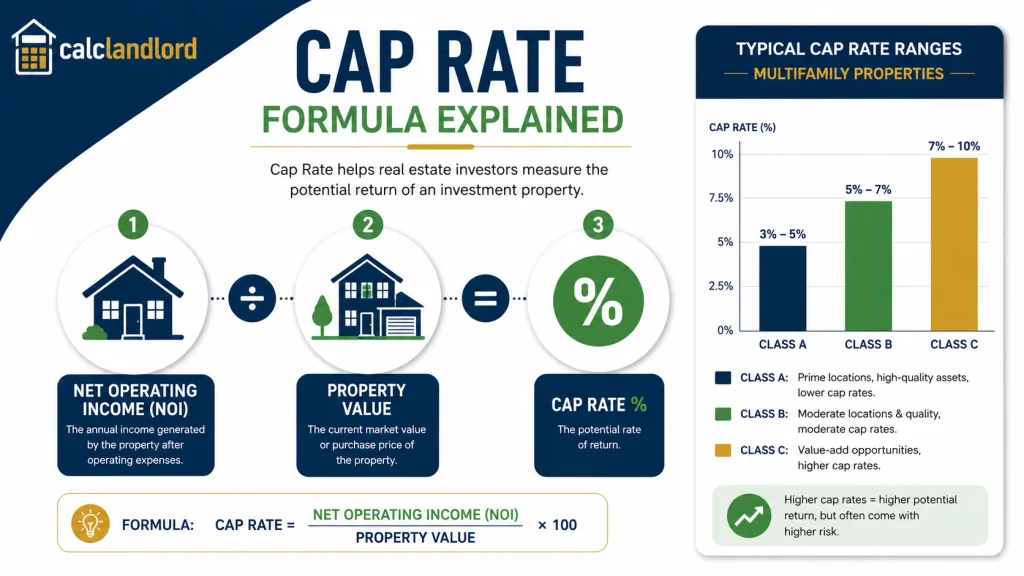
Cap rate (capitalization rate) is the ratio of a property’s annual net operating income (NOI) to its current market value or purchase price, expressed as a percentage. In landlord terms, it tells you the property’s unlevered income yield—what you’d earn in year one if you bought it all-cash, ignoring financing, taxes, and appreciation.
Formula: Cap Rate = NOI ÷ Property Value × 100
Example: $30,000 NOI on a $500,000 property = 6% cap rate.
Why it matters: cap rate lets you compare dissimilar deals (different loans, prices, rents) on an apples-to-apples income basis and estimate fair value using market comps.
How Cap Rate Works in Rental Property Investing
Cap rate isolates the property’s operating performance from how you finance it. That’s why appraisers, brokers, and investors use it to value income properties: value ≈ NOI ÷ market cap rate.
For landlords, cap rate is most useful when:
- Screening deals quickly across neighborhoods or asset types.
- sanity-checking listing claims (e.g., “9% return!” that really means gross rent yield).Estimating what a property should sell for based on verified NOI and local comps.
In 2026, with interest rates still influential, cap rates help you see how much of your return comes from income vs leverage and appreciation.
Cap Rate Formula: The Exact Calculation You Need
Standard formula:
\text{Cap Rate} = \frac{\text{NOI}}{\text{Property Value}} \times 100
Reverse (valuation) formula:
\text{Property Value} = \frac{\text{NOI}}{\text{Cap Rate}}
Key assumptions:
- NOI is annual and stabilized (more on this later).
- Property value is current market value or purchase price—not last year’s basis.
- Debt service (mortgage) is excluded from NOI by definition.
How to Calculate Cap Rate Step by Step (With Example)
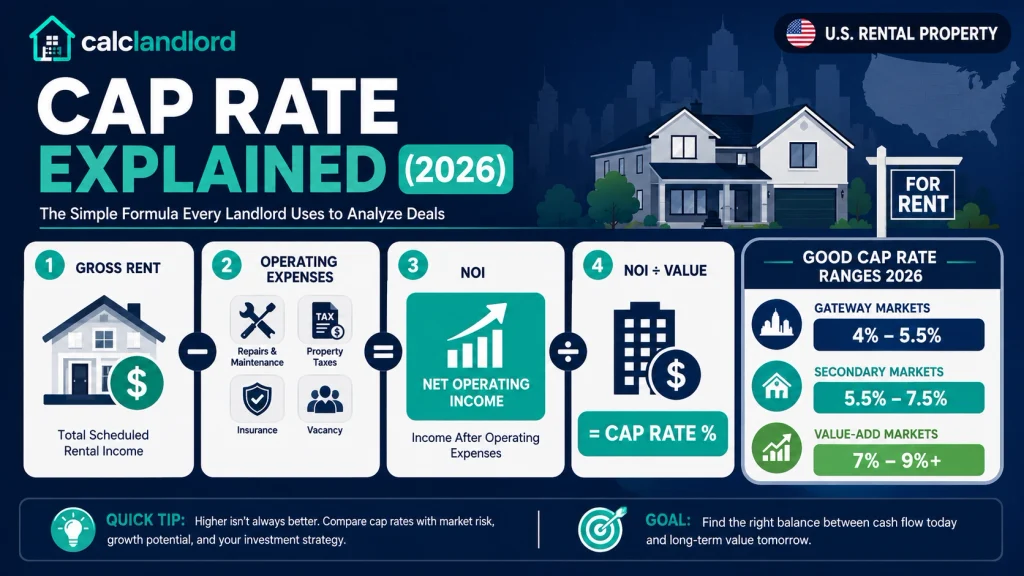
Step 1: Gross annual rental income
Monthly rent × 12. Example: $2,200 × 12 = $26,400.
Step 2: Annual operating expenses (typical landlord line items)
- Property taxes
- Insurance
- Property management (8–12% of collected rent)
- Maintenance/repairs reserve
- Vacancy allowance (5–10% of gross rent, market-dependent)
- Landlord-paid utilities, HOA/association dues, landscaping, etc.
Step 3: NOI
NOI = Gross rent − Operating expenses (no mortgage).
S4: Cap rate
Cap Rate = NOI ÷ Purchase price (or current value) × 100.
Worked SFR example (2026-style assumptions):
- Price: $425,000
- Rent: $2,200/mo → $26,400/yr
- Expenses: taxes $7,200; insurance $1,600; management 10% ($2,640); maintenance $2,000; vacancy 5% ($1,320) → Total $14,760
- NOI: $26,400 − $14,760 = $11,640
- Cap rate: $11,640 ÷ $425,000 = 2.74% (low, typical of some high-price, low-yield markets)
Use CalcLandlord’s Cap Rate Calculator to test different expense and vacancy assumptions instantly.
What Counts in NOI (and What Doesn’t) for Cap Rate
Include in NOI (operating items):
- Property taxes and insurance
- Property management fees
- Routine repairs & maintenance reserves
- Vacancy allowance
- Landlord-paid utilities, HOA/association dues, landscaping/snow removal
Exclude from NOI (non-operating or financing):
- Mortgage principal and interest (debt service)[
- Income taxes and depreciation (tax/accounting items)[
- Capital expenditures (roof/HVAC replacement) — treat separately in cash flow/IRR models.
- Owner’s personal expenses
Critical mistake to avoid: including mortgage payments in NOI. That turns cap rate into a levered metric and breaks comparability.
What Is a Good Cap Rate in 2026 for U.S. Rentals?
There’s no universal “good” cap rate—it depends on asset class, market tier, and your strategy. In 2026, many investors still view 5–8% as a healthy range for many secondary and Sun Belt markets, while gateway markets often compress lower
General guidance (not a rule):
- Lower cap rates (≈4–5.5%): often gateway/stable markets, stronger tenant demand, lower immediate cash flow, higher appreciation potential.
- Mid cap rates (≈5.5–7.5%): common in secondary markets and many SFR/small multifamily deals.
- Higher cap rates (≈7–9%+): more cash flow now, but often higher risk (older stock, tertiary markets, more management intensity).
Commercial surveys in H1 2026 show prime commercial income assets averaging roughly 6.5–7% cap rates, but small residential rentals can differ materially by metro. Always benchmark against local comps, not national headlines.
Cap Rate by Property Type and Market (2026 Benchmarks)
Cap rates vary by asset class and liquidity. Recent 2026 reporting highlights:
- Single-tenant net lease (retail/industrial/office): asking cap rates around 6.55% (retail), 7.15% (industrial), 7.90% (office) for investment-grade leases in Q1 2026.
- Prime commercial income assets: broadly 6.5–7% in H1 2026, with sentiment split despite volatile Treasury yields.
For small landlords (SFR, 2–4 units, small multifamily), use local sold comps and current listings to derive market cap rates; national commercial averages are only a rough anchor. Typical patterns:
- Gateway metros (e.g., NYC, SF, LA): lower cap rates due to stability and liquidity premiums.
- Sun Belt/secondary metros: often mid-to-higher cap rates with stronger cash flow
Use CalcLandlord’s Market Comparison Calculator (cluster idea) to compare cap rates across target neighborhoods.
Cap Rate vs Cash-on-Cash vs ROI: Which Metric to Use When
These metrics answer different questions:
| Metric | Formula (simplified) | Includes Financing? | Best For |
| Cap Rate | NOI ÷ Value | No | Unlevered income comparison; quick screening; valuation via comps |
| Cash-on-Cash | Annual cash flow ÷ Cash invested | Yes | Evaluating your actual first-year return with a specific loan |
| ROI | Total gain − cost ÷ cost (over hold) | Yes | Total return including appreciation, sale proceeds, tax effects |
Decision rule:
- Use cap rate to compare properties and estimate value.
- Use cash-on-cash to judge a specific financing scenario.
- Use ROI/IRR for multi-year hold comparisons and exit strategies.
Never compare a levered metric (cash-on-cash) to an unlevered one (cap rate) as if they’re the same.
- More Explore: https://calclandlord.com/property-investment-returns/
Going-In Cap Rate vs Exit Cap Rate: Planning Your Hold Period
Going-in cap rate: first-year stabilized NOI ÷ purchase price. This is your entry yield.
Exit (terminal) cap rate: projected NOI at sale ÷ expected sale price, used to estimate disposition value in hold-period models. Industry practice often assumes exit caps 50–100 bps higher than going-in to reflect aging and uncertainty.
Why landlords care:
- A 5.5% going-in cap with a 6.25% exit cap materially changes your projected IRR and sale proceeds.
- For value-add deals, model stabilization (rent-up, expense fixes) before applying market cap rates.
Use CalcLandlord’s ROI Calculator or Property Appreciation Calculator to model hold-period scenarios with different exit caps.
How to Use Cap Rate to Compare Rental Properties
Cap rate shines when you normalize income and expenses:
- Verify T-12 financials and rent rolls; don’t rely on pro forma alone.
- Standardize vacancy, management, and maintenance assumptions across deals.
- Compare within the same asset class and submarket (SFR vs SFR, not SFR vs office).
Quick screen:
- Property A: $28,000 NOI, $450,000 price → 6.22%
- Property B: $22,000 NOI, $380,000 price → 5.79%
All else equal, Property A yields more income per dollar of price—but check condition, location, and growth potential.
Using Cap Rate to Estimate Property Value and Offers
Appraisers and investors often value properties via:
\text{Value} = \frac{\text{NOI}}{\text{Market Cap Rate}}
Practical workflow for landlords:
- Determine market cap rate from recent closed comps (same asset class/submarket).
- Calculate your verified NOI (T-12, realistic vacancy/expenses).
- Compute implied value and compare to asking price.
Negotiation script (example):
“Based on recent comps trading at 6.5–7.0% cap and your verified NOI of $28,000, market value is approximately $400,000–$430,000. Our offer of $410,000 reflects a 6.8% cap rate, which accounts for [roof age, lease rollover, etc.].”
This approach anchors your offer in income and market data, not emotion.
7 Cap Rate Mistakes Landlords and Investors Make
- Including mortgage payments in NOI — invalidates cap rate.
- Using gross rent instead of NOI — ignores taxes, insurance, maintenance, vacancy, management.
- Ignoring realistic vacancy — sellers assume 100% occupancy; model 5–10% (or local norm).
- Using outdated purchase price — recalculate with current market value to reflect opportunity cost.
- Comparing across asset classes — a 6% cap on SFR ≠ 6% cap on retail/office. rate as total return — it excludes appreciation, leverage, and tax effects.
- Applying market cap rates to unstabilized NOI — lease-up or value-add properties need stabilized NOI or DCF.
When Cap Rate Misleads: Limitations Every Landlord Should Know
c, r is a static, one-year, unlevered metric. Limitations include:
- No rent growth or expense changes — use DCF/IRR for value-add or multi-year plans.
- Ignores financing — two buyers at the same cap can have very different equity returns.
- Market-dependent — only meaningful vs local, like-kind comps.
- Unreliable for non-stabilized assets — high vacancy, major renovations, or seasonal STRs need alternative lenses (price-per-unit, DCF).
Use c r as a screening and valuation tool, then layer in cash-on-cash, DSCR, and IRR for financing and hold-period decisions.
Cap Rate Calculator Guide: How to Use CalcLandord’s Tool
CalcLandlord’s Cap Rate Calculator helps you:
- Input gross rent, vacancy, and all operating expenses to compute NOI automatically.
- Calculate c r from NOI and price/value.
- Reverse-calculate implied value from NOI and a target market c, r.
- Compare multiple properties side-by-side with consistent assumptions.
How to use it:
- Enter monthly rent and annualize it.
- Add realistic expenses (taxes, insurance, management, maintenance, vacancy).
- Input purchase price or current value.
- Review cap rate and test “what-if” scenarios (e.g., 5% vs 8% vacancy).
- Save or export for your deal file.
Pair it with CalcLandlord’s Cash Flow Calculator and Cash-on-Cash Return Calculator to see how financing changes your returns.
People Also Ask: Cap Rate Explained
Many investors target 5–8% in secondary/Sun Belt markets, with gateway markets often lower; “good” depends on risk, location, and strategy.
No. Cap rate uses NOI, which explicitly excludes debt service.
Annual rent − operating expenses = NOI; then NOI ÷ price (or value) × 100 = cap rate.
Cap rate is unlevered, one-year income yield; cash-on-cash is levered first-year cash return; ROI is total return over the hold including sale.
Because cap rate ignores financing and one-time items; cash flow reflects your actual loan payments and reserves.
Yes, but model higher operating expenses (cleaning, platform fees, management) and occupancy volatility; ensure NOI is realistic.
Conclusion: Key Takeaways and Next Steps
- Cap rate = NOI ÷ Value — it measures unlevered income yield at a point in time.
- “Good” is contextual — 4.5–5.5% in some gateway markets vs 7–9% in higher-cash-flow markets can both make sense depending on risk and appreciation.
- Verify NOI rigorously — use T-12s, realistic vacancy, and full operating expenses; exclude mortgage.
- Use cap rate to compare and value — then switch to cash-on-cash/ROI for financing and hold-period decisions.
- Small cap moves = big value swings — a 0.5% cap shift on large NOI can mean hundreds of thousands in value.
Next steps for CalcLandlord readers:
- Run your deal through the Cap Rate Calculator.
- Model financing with the Cash-on-Cash Return Calculator.
- Compare neighborhoods with a Market Comparison approach (cluster topic).
- Read supporting guides: Cash Flow vs C ,R, How to Value a Rental Property (Income Approach), and Good C, R by Metro (2026

Pingback: The #1 Cash-on-Cash Return Mistake Costing You Cash
Pingback: Property Analysis: The 8-Step Deal-Killer Checklist