
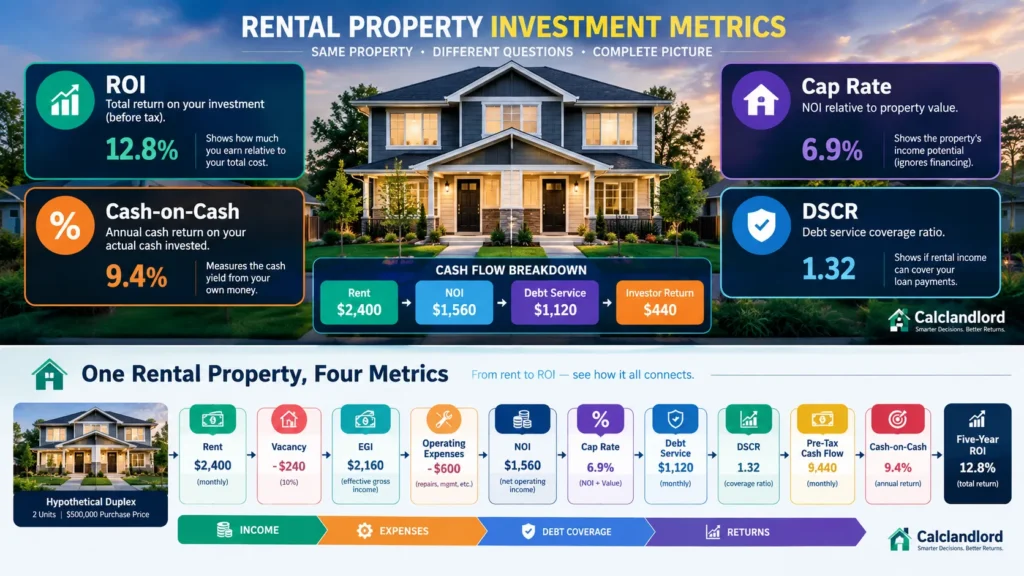
Rental Property Investment Metrics: ROI, Cap Rate, Cash-on-Cash Return & DSCR
A rental property can look like a great deal—until you run the right numbers. Gross rent alone does not tell you what you will actually earn. Cap rate measures unlevered property performance, cash-on-cash return shows the annual cash yield on your invested equity, and DSCR tests how comfortably income covers debt service. ROI goes further by looking at the broader investment outcome over time. The key is not choosing one “magic” metric. It is understanding what each number measures, where it can mislead you, and how the metrics work together before you commit your money to a property.
A rental property can look attractive on one metric and weak on another.
A property may have a strong cap rate but produce disappointing cash-on-cash returns after financing. Another may generate strong cash-on-cash returns because of heavy leverage while carrying a thin debt-service cushion. A third may have modest first-year cash flow but produce a stronger total return over a five-year hold because of rent growth, loan amortization, appreciation, or a successful value-add plan.
That is why experienced investors do not rely on one rental property metric.
The practical approach is to build the analysis from verified income and expenses, calculate effective gross income and net operating income (NOI), evaluate the property with cap rate, test the financing with DSCR, measure annual equity yield with cash-on-cash return, and then examine the full holding period with ROI, IRR, and equity multiple.
The framework below follows that integrated underwriting sequence: verify inputs, calculate NOI, evaluate unlevered performance, test debt coverage, measure equity cash yield, then stress-test the entire investment.
Quick answer:
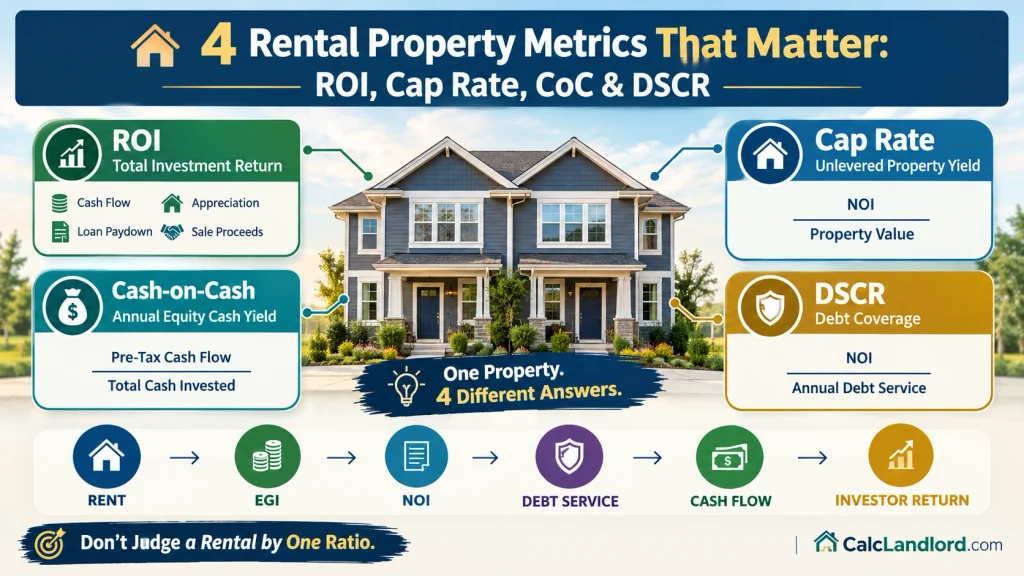
Cap rate measures a rental property’s unlevered income yield relative to its value. Cash-on-cash return measures annual pre-tax cash flow relative to the cash you invested. DSCR measures the property’s income relative to annual debt service. ROI is broader and should be defined according to the holding period and return components being measured. No single metric tells you whether a rental property is a good investment.
Rental Property Investment Metrics at a Glance
The four core metrics answer different questions.
| Metric | Basic Formula | Financing Included? | Best Use | Main Blind Spot |
| Cap Rate | NOI ÷ Property Value | No | Compare property income performance | Ignores debt structure and equity returns |
| Cash-on-Cash Return | Pre-Tax Cash Flow ÷ Total Cash Invested | Yes | Measure annual cash yield on equity | Can be distorted by leverage |
| DSCR | NOI ÷ Annual Debt Service | Yes | Evaluate debt coverage | Lender methodology can differ |
| Total ROI | Total Pre-Tax Profit ÷ Total Cash Invested | Usually | Evaluate the full holding period | Requires assumptions about the hold and exit |
| IRR | Discount rate producing NPV of zero | Yes | Measure annualized multi-period return | Highly sensitive to timing and assumptions |
| Equity Multiple | Total Cash Distributions ÷ Invested Equity | Yes | See how many dollars come back per dollar invested | Does not show the timing of those returns |
The metrics should not be treated as interchangeable.
A cap rate is not a cash-on-cash return. Cash-on-cash return is not the same as total ROI. DSCR is not a measure of investment profitability. IRR adds timing to the analysis, while equity multiple shows the total magnitude of distributions.
That distinction is important because one property can score differently depending on which question you ask.
Start With Accurate Rental Property Inputs
Every investment metric is only as reliable as the numbers behind it.
A mathematically perfect cap rate calculated from inflated rent and understated expenses is still a bad underwriting result.
Before calculating anything, separate your assumptions into three categories:
- Verified actuals
- Market-supported assumptions
- Investor estimates
For an existing rental, request source documents rather than relying exclusively on a seller’s pro forma.
Potential Gross Income
Potential Gross Income (PGI) is the property’s gross income potential before vacancy and collection losses.
For a simple long-term rental:
PGI = Scheduled Rent at Full Occupancy + Other Potential Rental Income
For example, a duplex collecting $1,700 per unit per month has:
- Monthly scheduled rent: $3,400
- Annual scheduled rent: $40,800
That is not necessarily the property’s actual effective income.
You still need to consider vacancy, concessions, delinquency, bad debt, and other income.
Market Rent Versus In-Place Rent
Do not automatically underwrite a property at the seller’s projected market rent.
Compare:
- Current lease rents
- Recent renewal rents
- Comparable rental listings
- Signed leases
- Local rent trends
- Property condition
- Unit size and amenities
- Parking and utility arrangements
A rent increase may be realistic, but it should have evidence behind it.
Vacancy and Credit Loss
A property that is occupied today does not have zero vacancy risk.
Underwriting should account for normal vacancy and collection loss based on the property’s history, tenant profile, local market, and asset type.
A duplex with two units also has concentrated vacancy risk. One vacant unit represents half of the property’s potential rent.
That matters much more than the same dollar vacancy in a large apartment property with dozens of units.
Operating Expenses
Common operating expenses may include:
- Property taxes
- Insurance
- Property management
- Routine maintenance and repairs
- Owner-paid utilities
- Landscaping
- Pest control
- Advertising and leasing
- Accounting
- Licensing
- HOA or association expenses
- Administrative costs
The IRS separately recognizes many rental expenses, including maintenance, insurance, taxes, management fees, repairs, utilities, mortgage interest, and depreciation for tax purposes, but tax treatment is not identical to investment underwriting treatment.
Maintenance Reserve Versus CapEx Reserve
Do not lump every property expense into one vague “maintenance” number.
Routine maintenance might include:
- Minor plumbing repairs
- Appliance service
- Patch-and-paint work
- Landscaping repairs
- Small electrical fixes
Capital expenditures can include major replacements such as:
- Roof
- HVAC system
- Major plumbing replacement
- Parking lot resurfacing
- Large exterior work
For investment analysis, many investors model a capital-expenditure reserve separately from NOI.
That makes the cash-flow picture more transparent.
Source Documents to Verify
Before trusting a rental pro forma, review:
| Input | Useful Verification |
| Rent | Rent roll, leases, bank deposits |
| Vacancy | Historical collections and occupancy |
| Property tax | Current tax bill and assessor records |
| Insurance | Current declarations and new quotes |
| Utilities | Recent utility bills |
| Repairs | Maintenance records and invoices |
| CapEx | Inspection, contractor estimates, replacement age |
| HOA | Budget, rules, special assessments |
| Management | Actual management quote |
| Legal/compliance | Local registration, licensing, safety requirements |
| Financing | Loan Estimate, term sheet, or lender underwriting |
For mortgage financing, the CFPB recommends reviewing the Loan Estimate for the loan amount, monthly principal and interest, taxes and insurance, estimated closing costs, and cash to close.
Build the Rental Property Cash-Flow Waterfall
The easiest way to understand the four core metrics is to build the property’s cash flow in the correct order.
Step 1: Potential Gross Income
Potential Gross Income = Scheduled Rent + Other Potential Income
Step 2: Effective Gross Income
Subtract vacancy, concessions, and credit loss, then include realistic other income.
Effective Gross Income = PGI − Vacancy/Credit Loss + Other Income
Step 3: Net Operating Income
Subtract operating expenses.
NOI = Effective Gross Income − Operating Expenses
Step 4: Debt Service
Subtract principal and interest payments, where applicable.
Pre-Debt-Service NOI − Annual Debt Service = Cash Flow Before CapEx
Step 5: Capital Expenditure Reserve
For a more conservative property-level cash-flow view:
Cash Flow After CapEx Reserve = NOI − Debt Service − CapEx Reserve
Step 6: Pre-Tax Cash Flow
A simple investor cash-flow model can therefore look like:
Potential Gross Rent
− Vacancy & Credit Loss
+ Other Income
= Effective Gross Income
− Operating Expenses
= Net Operating Income
− Annual Debt Service
− Capital Expenditure Reserve
= Pre-Tax Cash Flow
The order matters.
What Belongs in NOI?
| Item | Operating Expense? | Included in NOI? | Cash Expense? |
| Property taxes | Yes | Yes | Yes |
| Insurance | Yes | Yes | Yes |
| Property management | Yes | Yes | Yes |
| Routine repairs | Yes | Yes | Yes |
| Vacancy/credit loss | Yes | Yes | Yes |
| Owner-paid utilities | Yes | Yes | Yes |
| HOA dues | Usually | Usually | Yes |
| Mortgage principal | No | No | Yes |
| Mortgage interest | No | No | Yes |
| Capital expenditures | Usually separate | Usually no | Yes |
| Depreciation | No | No | No |
| Income taxes | No | No | Yes, but separately modeled |
Depreciation is a non-cash tax item and should not be treated as a cash operating expense in a pre-tax cash-flow calculation. The IRS explains that depreciation is used to recover the cost of income-producing property through deductions over time.
Likewise, investment underwriting should not confuse mortgage principal with an operating expense. Principal reduces the loan balance and therefore builds equity, while still requiring cash payment.
Cap Rate Explained
Cap rate, or capitalization rate, measures a property’s NOI relative to its value or purchase price.
Cap Rate Formula
Cap Rate=NOIProperty Value×100\text{Cap Rate} = \frac{\text{NOI}}{\text{Property Value}} \times 100
Suppose a rental property produces $24,000 of NOI and is worth $300,000.
24,000÷300,000=8%24,000 \div 300,000 = 8\%
The cap rate is 8%.
What Cap Rate Tells You
Cap rate answers a relatively narrow question:
“What unlevered income yield does this property produce relative to its value?”
Because debt is excluded, cap rate can help compare properties without first mixing different financing structures into the analysis.
For example:
- Property A: 7.5% cap rate
- Property B: 7.5% cap rate
They have the same NOI-to-value relationship even if one buyer finances differently from the other.
Cap Rate Does Not Include Your Mortgage
Cap rate is calculated before debt service.
That means:
- Mortgage interest is not deducted from NOI.
- Mortgage principal is not deducted from NOI.
- Down payment does not appear in the cap-rate formula.
- Loan term does not change the cap rate directly.
That is one reason cap rate and cash-on-cash return can move in opposite directions.
Cap Rate Versus Rental Yield
Gross rental yield is usually based on gross rent relative to purchase price:
Gross Rental Yield=Annual Gross RentProperty Price×100\text{Gross Rental Yield} = \frac{\text{Annual Gross Rent}}{\text{Property Price}} \times 100
Cap rate uses NOI instead.
A property can have an attractive gross rental yield but a much weaker cap rate once taxes, insurance, management, repairs, vacancy, and other operating costs are included.
Reverse Cap Rate Valuation
Cap rate can also be used in the opposite direction.
Estimated Property Value=NOITarget Cap Rate\text{Estimated Property Value} = \frac{\text{NOI}}{\text{Target Cap Rate}}
Suppose a property produces $30,000 of NOI and comparable assets are being analyzed around a 7.5% cap-rate assumption:
30,000÷0.075=400,00030,000 \div 0.075 = 400,000
That produces an indicated value of $400,000 under that assumed cap rate.
This is not a guarantee of market value. It is an analytical relationship.
The result changes immediately when NOI or the selected cap rate changes.
Why a High Cap Rate Can Be a Warning Sign
A high cap rate is not automatically favorable.
The cap rate may be high because:
- Rent is unusually strong but unsustainable.
- The property has deferred maintenance.
- Insurance is understated.
- Property taxes may reset after a sale.
- Management costs are omitted.
- Vacancy is understated.
- A major capital expense is approaching.
- The location has weaker demand.
- Current tenants are paying above-market rent and may not renew.
- Reported income includes unusual or one-time revenue.
The right question is not:
“Is the cap rate high?”
The better question is:
“Is the NOI producing that cap rate durable, verified, and appropriately adjusted for risk?”
Cash-on-Cash Return Explained
Cash-on-cash return measures the annual cash yield generated by the property relative to the investor’s cash invested.
Cash-on-Cash Formula
Cash-on-Cash Return=Annual Pre-Tax Cash FlowTotal Cash Invested×100\text{Cash-on-Cash Return} = \frac{\text{Annual Pre-Tax Cash Flow}} {\text{Total Cash Invested}} \times 100
Suppose you invest $100,000 and the property generates $8,000 of annual pre-tax cash flow.
8,000÷100,000=8%8,000 \div 100,000 = 8\%
Your cash-on-cash return is 8%.
What Counts as Total Cash Invested?
A weak calculation might include only the down payment.
A more complete analysis may include:
- Down payment
- Closing costs
- Loan fees
- Initial repairs
- Immediate renovation
- Prepaid costs
- Initial operating reserves
- Other required acquisition cash
For example:
| Investment Item | Amount |
| Down payment | $75,000 |
| Closing costs | $7,500 |
| Initial repairs | $12,500 |
| Total cash invested | $95,000 |
The denominator is important.
If you ignore $12,500 of immediate repairs, you artificially improve the reported cash-on-cash return.
How Leverage Changes Cash-on-Cash Return
Debt can significantly affect cash-on-cash return because the investor is using borrowed capital.
Imagine a property with:
- NOI = $30,000
- Debt service = $18,000
- Pre-tax cash flow = $12,000
If total cash invested is $100,000:
12,000÷100,000=12%12,000 \div 100,000 = 12\%
Now suppose a different financing structure requires only $60,000 of cash but increases debt service enough to reduce annual cash flow to $8,000:
8,000÷60,000=13.3%8,000 \div 60,000 = 13.3\%
The second structure shows a higher cash-on-cash return even though annual cash flow is lower.
That is the leverage effect.
A higher CoC number does not automatically mean lower risk.
Positive Leverage Versus Negative Leverage
Leverage becomes especially important when comparing a property’s unlevered income yield with its debt burden.
Positive Leverage
Positive leverage can occur when the property’s economic yield is sufficiently above the effective burden of debt that financing improves the investor’s equity return, after considering amortization, financing costs, and risk.
For example, if a property has a strong NOI yield and financing costs are relatively manageable, debt may allow the investor to control the asset with less equity.
Negative Leverage
Negative leverage can occur when the property’s income yield is below the effective burden created by the debt.
The result may be:
- Lower cash-on-cash return
- Weak cash flow
- Thin debt-service coverage
- Higher break-even occupancy
- Greater sensitivity to vacancies and expenses
This is why looking only at the down payment is dangerous.
A 10% down payment can produce a mathematically impressive CoC number in one scenario while leaving the property with very little cash-flow cushion.
Cash-on-Cash Return Versus Cap Rate
A simple comparison:
| Cap Rate | Cash-on-Cash | |
| Based on | NOI | Pre-tax cash flow |
| Debt included? | No | Yes |
| Denominator | Property value | Investor cash invested |
| Main question | How does the property perform unlevered? | What annual cash yield am I earning on my equity? |
| Sensitive to financing? | No | Yes |
That is why investors often use both.
DSCR Explained for Rental Property Investors
Debt Service Coverage Ratio (DSCR) measures the relationship between property income and debt service.
DSCR Formula
A common investment-analysis formulation is:
DSCR=NOIAnnual Debt Service\text{DSCR} = \frac{\text{NOI}} {\text{Annual Debt Service}}
Suppose:
- NOI = $30,000
- Annual debt service = $24,000
Then:
30,000÷24,000=1.2530,000 \div 24,000 = 1.25
The property produces $1.25 of NOI for every $1.00 of annual debt service under that calculation.
What Different DSCR Ratios Mean
| DSCR | Basic Interpretation |
| Below 1.00 | NOI is below stated debt service |
| 1.00 | NOI exactly covers stated debt service |
| 1.10 | 10% coverage cushion |
| 1.20 | 20% coverage cushion |
| 1.25 | 25% coverage cushion |
| 1.50 | 50% coverage cushion |
| Above 1.50 | Larger cushion under the stated assumptions |
These are mathematical interpretations, not universal lending approval standards.
A lender may require a specific DSCR depending on:
- Loan program
- Property type
- LTV
- Credit profile
- Reserves
- Loan term
- Interest rate
- Documentation
- Underwritten rents
- Debt-service methodology
Investor DSCR Versus Lender DSCR
This distinction is critical.
For your own investment analysis, you may calculate:
Investor DSCR=NOIAnnual Debt Service\text{Investor DSCR} = \frac{\text{NOI}} {\text{Annual Debt Service}}
But a lender may calculate qualifying cash flow differently.
Depending on the program, the lender’s methodology may use different income definitions, market rent, in-place rent, lease-supported income, property taxes and insurance, PITIA, or a stressed payment.
Therefore:
Your DSCR calculation is an investment-analysis tool. A lender’s DSCR calculation is a qualification methodology governed by that lender’s program.
Never assume your spreadsheet’s DSCR guarantees loan approval.
DSCR Is Not the Same as Cash Flow
Two properties can have the same DSCR and different cash-on-cash returns because their required equity investments differ.
Likewise, two properties can have similar cash flow but different DSCRs because their annual debt service differs.
DSCR focuses on debt coverage.
Cash-on-cash focuses on equity cash yield.
They overlap, but they answer different questions.
ROI Explained: What the Other Metrics Miss
“ROI” is one of the most useful and most abused terms in real estate.
Investors may use ROI to describe:
- First-year cash return
- Total holding-period return
- Cumulative cash flow
- Appreciation
- Equity growth
- Tax benefits
- Levered return
- Annualized return
Those calculations are not equivalent.
A Practical Rental Property ROI Formula
For a simplified pre-tax holding-period analysis:
Total Pre-Tax Profit=Cumulative Pre-Tax Cash Flow+Net Sale Proceeds+Other Cash Distributions−Total Cash Invested−Additional Capital Contributions\text{Total Pre-Tax Profit} = \text{Cumulative Pre-Tax Cash Flow} + \text{Net Sale Proceeds} + \text{Other Cash Distributions} – \text{Total Cash Invested} – \text{Additional Capital Contributions}
Then:
Holding-Period ROI=Total Pre-Tax ProfitTotal Cash Invested×100\text{Holding-Period ROI} = \frac{\text{Total Pre-Tax Profit}} {\text{Total Cash Invested}} \times 100
This is a simplified ROI measure.
It is not the same thing as IRR.
What Can Increase Total ROI?
Over a multi-year hold, total returns can come from several sources:
1. Cash flow
The property generates annual cash distributions.
2. Appreciation
The property’s market value increases.
3. Loan amortization
Part of each principal payment reduces the mortgage balance.
4. Forced appreciation
An investor may increase NOI through renovations, improved rents, expense management, or better operations.
5. Refinance proceeds
A refinance may unlock equity, although this creates a new debt obligation and should not be treated as free profit.
6. Tax effects
Tax results can materially affect after-tax returns, but they depend on individual facts and applicable tax rules.
The IRS notes that rental real estate may involve depreciation, deductible expenses, passive-activity limitations, and other tax rules that are separate from simple property cash-flow analysis.
ROI Versus IRR
IRR adds the timing of cash flows.
A property producing $100,000 of profit in Year 1 is economically different from a property producing the same $100,000 only after Year 10.
IRR captures that timing.
That makes IRR more useful when comparing investments with different holding periods or distribution schedules.
ROI Versus Equity Multiple
Equity multiple answers another simple question:
“How many total dollars did I receive for every dollar invested?”
For example, if you invest $100,000 and eventually receive $180,000 in cumulative distributions and proceeds:
180,000÷100,000=1.80×180,000 \div 100,000 = 1.80x
That is an 1.80× equity multiple.
Unlike IRR, equity multiple does not care when the cash arrives.
Complete Rental Property Investment Example
Consider a hypothetical U.S. duplex.
Property and Financing Assumptions
| Item | Assumption |
| Purchase price | $300,000 |
| Down payment | 25% |
| Down payment amount | $75,000 |
| Closing costs | $7,500 |
| Initial repairs | $12,500 |
| Total cash invested | $95,000 |
| Loan amount | $225,000 |
| Interest rate | 7.00% |
| Amortization | 30 years |
| Monthly scheduled rent | $3,400 |
| Annual scheduled rent | $40,800 |
| Vacancy/credit loss | 6% |
| Other income | $600/year |
The assumptions are hypothetical for illustration and are not a forecast.
Step 1: Calculate Effective Gross Income
Annual scheduled rent:
3,400×12=40,8003,400 \times 12 = 40,800
Vacancy and credit loss:
40,800×6%=2,44840,800 \times 6\% = 2,448
Assume $600 of annual other income.
Therefore:
40,800−2,448+600=38,95240,800 – 2,448 + 600 = 38,952
Effective Gross Income = $38,952
Step 2: Calculate Operating Expenses
Assume:
| Operating Expense | Annual Amount |
| Property taxes | $4,200 |
| Insurance | $1,800 |
| Property management | $3,116 |
| Routine repairs/maintenance | $1,800 |
| Utilities | $600 |
| Landscaping | $720 |
| Licensing/administrative | $300 |
| Total Operating Expenses | $12,536 |
Now calculate NOI:
38,952−12,536=26,41638,952 – 12,536 = 26,416
NOI = $26,416
Step 3: Calculate Cap Rate
26,416÷300,000=8.805%26,416 \div 300,000 = 8.805\%
Rounded:
Cap Rate ≈ 8.81%
Notice that no mortgage payment appears in this calculation.
Step 4: Calculate Annual Debt Service and DSCR
The $225,000 loan at 7% over 30 years produces an illustrative monthly principal-and-interest payment of about $1,496.93.
Annual debt service:
1,496.93×12≈17,9631,496.93 \times 12 \approx 17,963
Now calculate DSCR:
26,416÷17,963≈1.4726,416 \div 17,963 \approx 1.47
DSCR ≈ 1.47
Under this simplified investor calculation, the property generates about $1.47 of NOI for every $1 of annual debt service.
Step 5: Calculate Pre-Tax Cash Flow
Suppose you also maintain a $1,500 annual CapEx reserve.
26,416−17,963−1,500=6,95326,416 – 17,963 – 1,500 = 6,953
Pre-Tax Cash Flow ≈ $6,953
Step 6: Calculate Cash-on-Cash Return
Total cash invested:
75,000+7,500+12,500=95,00075,000 + 7,500 + 12,500 = 95,000
Then:
6,953÷95,000=7.32%6,953 \div 95,000 = 7.32\%
Cash-on-Cash Return ≈ 7.32%
Compare the Four Metrics
| Metric | Result |
| Cap rate | 8.81% |
| DSCR | 1.47 |
| Pre-tax cash flow | $6,953/year |
| Cash-on-cash return | 7.32% |
Notice how each number tells a different story.
The 8.81% cap rate describes unlevered property income.
The 1.47 DSCR describes debt coverage under the stated assumptions.
The $6,953 cash flow shows the annual cash left after debt service and the illustrative CapEx reserve.
The 7.32% CoC return measures that cash flow against the investor’s $95,000 of initial cash.
That is exactly why investors should stack metrics rather than choose one favorite ratio.
Estimate a Five-Year ROI Scenario
Now extend the same hypothetical property over five years.
Assume, strictly for illustration:
- Property appreciation averages 3% annually.
- Annual cash flow grows gradually as rents and expenses change.
- The mortgage amortizes normally.
- Selling costs are estimated at 7% of the sale price.
- Taxes are excluded from this pre-tax scenario.
- There is no extraordinary capital event.
- No refinance is assumed.
Estimated Property Value After Five Years
300,000×1.035≈347,782300,000 \times 1.03^5 \approx 347,782
Estimated value:
≈ $347,800
This is an assumption, not a prediction.
Estimated Loan Balance After Five Years
Under the stated loan assumptions, the remaining balance is approximately:
$211,800
Before considering selling costs, the equity created by appreciation and principal reduction is therefore reflected in the difference between the property’s value and remaining loan.
Estimated Selling Costs
At an assumed 7%:
347,782×7%≈24,345347,782 \times 7\% \approx 24,345
Estimated net sale proceeds before taxes and before any other transaction adjustments:
347,782−24,345−211,800≈111,637347,782 – 24,345 – 211,800 \approx 111,637
So the investor might receive roughly $111,600 of net sale equity in this simplified scenario.
Add Cumulative Cash Flow
Suppose cumulative pre-tax cash flow over five years totals approximately $36,500 after the modeled CapEx reserve.
Then:
111,600+36,500=148,100111,600 + 36,500 = 148,100
Compared with $95,000 of initial cash invested:
148,100−95,000=53,100148,100 – 95,000 = 53,100
Simplified holding-period pre-tax ROI:
53,100÷95,000≈55.9%53,100 \div 95,000 \approx 55.9\%
Illustrative five-year pre-tax ROI ≈ 55.9%
This number should not be presented as a forecast.
It depends heavily on appreciation, rent growth, expenses, sale costs, operating performance, and the original financing assumptions.
It also does not replace an IRR calculation because the timing of annual cash flows matters.
Stress-Test the Deal Before You Buy
A base-case model tells you what happens if your assumptions are reasonably accurate.
A stress test tells you what happens when they are wrong.
That is where many rental-property analyses become useful.
Scenario 1: Rent Falls 5%
If annual scheduled rent falls by 5%, EGI declines.
The impact then flows through NOI, DSCR, and cash flow.
A property that appears comfortably profitable at today’s rent may become much less resilient when rent is lower.
Scenario 2: Vacancy Doubles
Suppose vacancy increases from 6% to 12%.
On $40,800 of scheduled rent:
40,800×12%=4,89640,800 \times 12\% = 4,896
Compared with $2,448 under the base case, that is another $2,448 of lost income.
That reduction flows almost directly through to NOI when other expenses remain unchanged.
Scenario 3: Insurance Increases 20%
Insurance can materially affect a rental’s NOI.
If annual insurance is $1,800:
1,800×20%=3601,800 \times 20\% = 360
The $360 increase reduces NOI by the same amount, all else equal.
A small individual expense can matter when the property’s margin is already thin.
Scenario 4: Property Taxes Reset
Do not automatically use the seller’s current tax bill.
A purchase may trigger reassessment under applicable local rules, and tax treatment varies by jurisdiction.
Underwriting should use the property’s likely post-acquisition tax burden where reasonably estimable.
Scenario 5: A Major CapEx Arrives Early
Imagine the duplex suddenly requires a $15,000 HVAC replacement.
If the investor has no reserve, the entire amount becomes an additional cash contribution.
That can sharply reduce actual CoC performance for the year.
Scenario 6: Interest Rates Rise at Refinance
A deal that works with today’s fixed-rate payment may not work under a much higher refinance rate.
This matters especially for:
- Short-term financing
- Bridge loans
- Adjustable-rate structures
- Value-add deals
- BRRRR strategies
- Loans with balloon maturities
The refinance should be underwritten before it becomes necessary.
Sensitivity Table
| Stress Case | Potential Effect |
| Rent −5% | Lower EGI, NOI, DSCR, and cash flow |
| Rent −10% | Greater decline in coverage and equity yield |
| Vacancy doubles | Lower EGI and NOI |
| Repairs +25% | Lower NOI and cash flow |
| Insurance +20% | Lower NOI |
| Higher post-sale property taxes | Lower NOI and DSCR |
| $15,000 near-term CapEx | Lower cash yield or higher cash contribution |
| Higher refinance rate | Higher debt service and potentially weaker DSCR |
| Higher purchase price | Lower cap rate and potentially lower CoC |
The most important output is often not the base-case return.
It is the point at which the deal stops working.
Break-Even Occupancy and Break-Even Rent
Break-even analysis helps answer:
“How much can the property underperform before I have to put money into it?”
A simplified break-even occupancy concept compares the property’s required annual cash obligations against potential gross income.
Depending on the level of analysis, you may include:
- Operating expenses
- Debt service
- Certain reserves
- Other fixed obligations
The exact formula should match your model.
For example, if the property requires $30,000 in annual expenses and debt service, while potential gross rent is $40,000:
30,000÷40,000=75%30,000 \div 40,000 = 75\%
A simplified break-even occupancy would be approximately 75% under those assumptions.
This is a screening calculation, not a substitute for a full property-specific model.
Break-even rent works similarly.
You solve backward to determine the monthly rental income required to cover the specified expenses and debt obligations.
How to Use ROI, Cap Rate, Cash-on-Cash and DSCR Together
The metrics become much more powerful when used in sequence.
1. Screen the Property
Start with:
- Purchase price
- Market rent
- Basic expenses
- Estimated NOI
- Rough cap rate
At this stage, you are trying to determine whether the property deserves deeper analysis.
2. Underwrite the Actual NOI
Replace estimates with:
- Verified rents
- Actual property taxes
- Current insurance
- Realistic maintenance
- Management costs
- Vacancy assumptions
- Utilities
- Other recurring expenses
Now you have a more defensible NOI.
3. Compare Cap Rate
Use cap rate to examine the property without mixing in your financing decision.
This is particularly useful when two properties have different financing offers.
4. Model the Loan
Add:
- Loan amount
- Interest rate
- Amortization
- Debt service
- Financing fees
- Prepayment provisions
- Refinance terms where applicable
Then calculate DSCR and cash flow.
5. Calculate Cash-on-Cash Return
Now determine how efficiently your actual invested equity is producing annual cash flow.
Include acquisition cash requirements rather than using only the down payment.
6. Model Total ROI
Extend the analysis over the planned holding period.
Add realistic assumptions for:
- Rent growth
- Expense growth
- Appreciation
- Principal paydown
- Capital improvements
- Refinance proceeds
- Selling costs
7. Run Downside Scenarios
Test assumptions that could materially damage the deal.
8. Decide What to Negotiate
Instead of asking whether the property is “good” in isolation, identify the variables that need to change.
For example:
- Lower purchase price
- Better financing
- Seller credit
- Repair credit
- Longer closing period
- Updated rent assumptions
- More realistic property-tax estimate
Maximum Offer Price Based on Your Target Metrics
Investment analysis becomes more powerful when you solve for price instead of simply analyzing the seller’s asking price.
Cap-Rate-Based Maximum Price
If your target cap rate is 7.5% and verified NOI is $30,000:
30,000÷0.075=400,00030,000 \div 0.075 = 400,000
The mathematical result is $400,000.
That does not mean you should pay $400,000.
It means $400,000 produces a 7.5% cap rate using that NOI.
Cash-on-Cash-Based Price
You can also work backward from a target CoC return.
Suppose you want a 8% annual cash-on-cash return.
If projected annual pre-tax cash flow is $16,000:
16,000÷0.08=200,00016,000 \div 0.08 = 200,000
That suggests $200,000 of total invested equity under the simplified formula.
You then reverse-engineer the purchase price and financing assumptions that produce that equity requirement.
DSCR-Based Price
Debt size can also be constrained by a minimum DSCR.
If:
- NOI = $30,000
- Minimum investor DSCR = 1.25
Then maximum annual debt service under that assumption is:
30,000÷1.25=24,00030,000 \div 1.25 = 24,000
So annual debt service should not exceed approximately $24,000 under the model.
The actual loan amount then depends on the interest rate, amortization, loan type, and lender methodology.
This approach lets you solve the acquisition from the metrics backward.
Common Rental Property Investment Metric Mistakes
Using Gross Rent Instead of NOI
This can make a property look dramatically more profitable than it really is.
Gross rent is the starting point.
NOI is the more useful operating-profit figure for cap-rate and many DSCR calculations.
Ignoring Vacancy
A property does not have to be completely vacant for vacancy to affect returns.
Tenant turnover, leasing periods, nonpayment, and concessions can all reduce collections.
Excluding Management Because You Self-Manage
Self-management still has an economic cost.
Even if you do not write a monthly check to a manager, your time has value.
A useful underwriting practice is to model a management expense anyway, then decide whether the actual operation produces enough additional value to justify self-management.
Treating CapEx as Ordinary Maintenance
A $300 repair and a $15,000 roof replacement are not economically equivalent.
Separating routine maintenance from major capital expenditures creates a clearer picture of long-term cash needs.
Counting Depreciation as Cash Expense
Depreciation can reduce taxable rental income, but it is not a cash payment.
The IRS treats depreciation as a mechanism for recovering the cost of income-producing property over time.
Ignoring Acquisition Costs
A property requiring $75,000 down plus $20,000 of closing and repair costs does not have a $75,000 equity investment.
The additional cash matters when calculating CoC.
Trusting Pro Forma Rent Without Verification
Projected rent is an assumption until supported by credible market evidence or signed lease information.
Treating DSCR as a Guaranteed Loan Approval
A spreadsheet DSCR is not the same thing as lender underwriting.
Always use the actual lender’s written methodology when evaluating qualification.
Relying on Cap Rate Alone
Cap rate does not tell you:
- How much cash you need
- How much debt costs
- How much equity you build
- What happens when rents fall
- What happens at sale
- What taxes do to your after-tax return
Assuming Appreciation Will Fix Weak Cash Flow
Appreciation is an assumption until it happens.
A property should be analyzed against current operating economics as well as the investor’s long-term thesis.
Related Rental Property Metrics Worth Tracking
The four core metrics are not the only useful measures.
Gross Rent Multiplier
GRM=Property PriceGross Annual Rent\text{GRM} = \frac{\text{Property Price}} {\text{Gross Annual Rent}}
GRM is a fast screening ratio but ignores operating expenses.
Debt Yield
A simplified debt-yield concept is:
Debt Yield=NOILoan Amount×100\text{Debt Yield} = \frac{\text{NOI}} {\text{Loan Amount}} \times 100
It helps relate property NOI to the amount of debt secured by the property.
Loan-to-Value Ratio
LTV=Loan AmountProperty Value×100\text{LTV} = \frac{\text{Loan Amount}} {\text{Property Value}} \times 100
LTV is a financing measure rather than a profitability metric.
Break-Even Occupancy
This helps estimate the occupancy level required to cover modeled obligations.
Equity Multiple
This summarizes total distributions relative to invested capital.
IRR
IRR accounts for the timing of cash flows and is particularly useful for multi-year investment comparisons.
Return on Cost
For value-add properties, investors may also compare stabilized NOI with the property’s all-in cost.
These metrics can be useful, but they should support rather than replace the four core measures.
How the Metrics Behave in Different Rental Strategies
Not every property should be underwritten exactly the same way.
Single-Family Rental
Pay close attention to:
- Market rent
- Property taxes
- Insurance
- Maintenance
- Tenant turnover
- Long-term appreciation assumptions
A single-family rental may produce less immediate cash yield while relying more heavily on long-term appreciation or principal reduction.
Duplex, Triplex, or Fourplex
Small multifamily properties create a different vacancy dynamic.
One vacant unit can have a large percentage impact on income.
Analyze each unit separately where practical.
Larger Multifamily
NOI and stabilized operations become increasingly important.
Watch:
- In-place versus market rents
- Expense ratios
- Concessions
- Turnover
- Payroll
- Utilities
- Capital expenditures
- Exit cap rate
Value-Add Rental
Do not mix today’s NOI with tomorrow’s renovated property value without clearly labeling the assumptions.
Separate:
- Current in-place NOI
- Stabilized NOI
- Renovation costs
- Rent assumptions
- Lease-up period
- Financing costs
- Exit assumptions
BRRRR Strategy
For a Buy, Rehab, Rent, Refinance, Repeat strategy, evaluate:
- Acquisition price
- Renovation budget
- All-in basis
- After-Repair Value
- Stabilized rent
- Stabilized NOI
- Refinance proceeds
- Post-refinance debt service
- Remaining cash invested
- Post-refinance DSCR and CoC
The refinance should be stress-tested rather than assumed to rescue an acquisition that has weak fundamentals.
Using a Rental Property Calculator
A rental property calculator can make this analysis faster, but the calculator cannot decide whether your assumptions are realistic.
A useful calculator should allow you to enter:
- Purchase price
- Down payment
- Closing costs
- Rehab costs
- Monthly rent
- Vacancy
- Other income
- Taxes
- Insurance
- Management
- Repairs
- Utilities
- HOA
- Loan amount
- Interest rate
- Loan term
- CapEx reserve
It should then help calculate:
- Effective gross income
- NOI
- Cap rate
- Annual debt service
- DSCR
- Pre-tax cash flow
- Cash-on-cash return
- Holding-period ROI
- Break-even metrics
Use the CalcLandlord rental property calculator alongside your assumptions, then verify the inputs against leases, tax bills, insurance quotes, inspection findings, and lender documents.
The calculator is there to reduce arithmetic errors.
It cannot tell you whether the seller’s projected rent is credible.
Rental Property Metrics Decision Framework
Instead of looking for one magic number, build a scorecard around the questions that matter.
| Question | Metric or Analysis |
| Does the property’s income support the price? | Cap rate |
| Will the property’s income cover the debt? | DSCR |
| What annual cash yield will my equity produce? | Cash-on-cash return |
| What could I make over the entire hold? | Total ROI |
| How quickly do returns arrive? | IRR |
| How many dollars come back per dollar invested? | Equity multiple |
| What happens if assumptions fail? | Sensitivity analysis |
| What is the highest price that meets my criteria? | Reverse underwriting |
| Which assumptions are most uncertain? | Due diligence |
A practical buy / renegotiate / pass framework can therefore be built without reducing the decision to a single ratio:
Underwrite Further
The numbers remain workable after realistic assumptions and downside testing.
Renegotiate
The property may become workable if price, financing, repairs, seller credits, or other terms change.
Pass
The underwriting does not meet your required economics even after reasonable adjustments.
That framework is more useful than declaring one universal “good” cap rate, CoC return, or DSCR threshold because market conditions, property quality, leverage, taxes, insurance, and investor objectives vary.
People Also Ask About Rental Property Investment Metrics
What is the most important metric for a rental property?
There is no single metric that answers every investment question.
Cap rate helps evaluate unlevered property income, DSCR evaluates debt coverage, cash-on-cash return evaluates annual equity cash yield, and ROI evaluates broader investment performance.
The most useful metric depends on the question being asked.
Is cap rate the same as ROI?
No.
Cap rate is based on NOI relative to property value.
ROI can include multiple sources of investment profit, including cash flow, appreciation, loan paydown, and sale proceeds.
Cap rate is one operating-performance measure, not a complete holding-period return calculation.
Is cash-on-cash return the same as ROI?
No.
Cash-on-cash return generally measures annual pre-tax cash flow relative to invested cash.
Total ROI can include appreciation, principal reduction, sale proceeds, and other return components over the holding period.
Can a rental property have a good cap rate but poor cash flow?
Yes.
A property can have a strong NOI-to-price relationship but weak cash flow after financing.
This can happen when debt service is high because of:
- High interest rates
- Large loan balance
- Short amortization
- High leverage
Can a property have positive cash flow but weak DSCR?
Yes, depending on the calculation and other cash expenses.
A property may show positive investor cash flow after certain assumptions while still having a relatively thin NOI-to-debt-service cushion.
The relationship depends on exactly what is included above and below the debt-service line.
Does DSCR include property taxes and insurance?
It depends on the DSCR methodology.
An investor’s simplified DSCR may use NOI divided by annual principal-and-interest debt service.
A lender may use a different methodology that incorporates additional property costs or different income assumptions.
Always follow the applicable loan program’s written calculation.
What is a good DSCR for a rental property?
There is no universal number that applies to every lender, loan, or property.
Mathematically, a DSCR above 1.00 means the stated NOI exceeds the stated debt service.
The margin above 1.00 matters because the property has to withstand operating volatility.
Lender requirements vary by loan program and borrower/property circumstances.
What is a good cap rate for a rental property?
There is no universal “good cap rate.”
Cap rates vary with:
- Location
- Property type
- Asset quality
- Lease structure
- Growth expectations
- Financing environment
- Risk
- Market conditions
A high cap rate can reflect higher risk rather than superior economics.
What is a good cash-on-cash return?
There is no universal target that should be applied to every rental.
CoC should be considered together with:
- Risk
- Leverage
- Cash-flow stability
- Appreciation assumptions
- Capital requirements
- Property condition
- Investor goals
A higher CoC created primarily by aggressive leverage may carry more risk than a lower CoC supported by stronger property fundamentals.
How do I calculate the maximum price to pay for a rental property?
Start with the investor criteria you need to satisfy.
For cap rate:
Maximum Price=NOITarget Cap Rate\text{Maximum Price} = \frac{\text{NOI}} {\text{Target Cap Rate}}
For cash-on-cash return, solve backward from the target cash return and the financing assumptions.
For DSCR, solve for the maximum debt service and then determine the loan amount supported by the lender’s rate, term, and methodology.
Use the most conservative reasonable result after stress testing.
Should I include CapEx in NOI?
For standard property-level cap-rate analysis, capital expenditures are generally modeled separately from NOI rather than treated as recurring operating expenses.
However, investors should still reserve for major capital needs when evaluating actual cash requirements.
Should mortgage principal be included in NOI?
No.
Mortgage principal is a financing item, not an operating expense.
It reduces the loan balance and therefore builds equity.
Does depreciation affect cash-on-cash return?
Not directly in a pre-tax cash-flow calculation because depreciation is non-cash.
It can affect taxable income and therefore after-tax returns.
Tax treatment varies with the investor’s circumstances, entity structure, property use, and applicable tax rules. The IRS discusses rental depreciation and rental-income reporting in Publication 527.
What closing costs should I include in my investment analysis?
For investment underwriting, include the cash required to acquire the property, such as applicable lender fees, title-related costs, prepaid items, and other acquisition costs.
The tax treatment of individual closing costs is a separate issue. The IRS explains that some acquisition-related costs are added to the property’s basis rather than deducted immediately.
What should I verify before trusting a rental property pro forma?
At minimum, verify:
- Rent roll
- Leases
- Collections
- Property taxes
- Insurance
- Utilities
- Repair history
- Inspection findings
- Management cost
- HOA obligations
- Capital needs
- Local legal and licensing requirements
For financed purchases, compare the lender’s Loan Estimate with your underwriting assumptions and review the estimated cash to close and loan terms.
Final Rental Property Metrics Checklist
Before committing capital, make sure your analysis answers all of these questions:
Income
- What is the actual in-place rent?
- What is realistic market rent?
- What vacancy and credit loss are appropriate?
- Is other income recurring?
Operating Expenses
- Are taxes current?
- Is insurance based on a current quote?
- Is management included?
- Are repairs realistic?
- Are utilities accurately allocated?
- Are CapEx reserves separate?
Cap Rate
- What is verified NOI?
- What cap rate does the actual purchase price produce?
- Is the cap rate supported by durable income?
Financing
- What is the loan amount?
- What is the interest rate?
- What is the amortization period?
- What is annual debt service?
- What is the investor DSCR?
- How will the lender calculate DSCR?
Cash-on-Cash
- How much cash is actually required?
- Does total invested cash include closing and repair costs?
- What annual pre-tax cash flow remains after debt service?
- Does the result survive a downside scenario?
Total Return
- What is the planned holding period?
- What assumptions drive appreciation?
- How much principal is expected to be repaid?
- What are the selling costs?
- What is the expected total pre-tax ROI?
- What is the IRR?
- What is the equity multiple?
Downside
- What happens if rent falls 5%?
- What happens if vacancy doubles?
- What happens if insurance rises?
- What happens after a property-tax reset?
- What happens if a major CapEx arrives early?
- What happens if refinancing becomes more expensive?
If the answer changes dramatically from a small assumption change, the property has a thinner margin of safety than the base-case model suggests.
Conclusion
Rental property investment metrics work best as a system.
Cap rate tells you how the property performs on an unlevered income basis.
DSCR tells you how comfortably the property’s income covers its debt service under the stated methodology.
Cash-on-cash return tells you how much annual pre-tax cash flow your invested equity is generating.
ROI looks more broadly at the investment outcome over the holding period and can incorporate cash flow, appreciation, loan paydown, and sale proceeds.
And IRR adds something the basic ROI formula does not: the timing of those cash flows.
The best rental-property analysis therefore does not stop after calculating one percentage.
Start with verified income and expenses. Build realistic NOI. Calculate cap rate. Model the loan. Test DSCR. Calculate cash-on-cash return. Extend the analysis through the expected holding period. Then stress-test the assumptions before deciding what price and financing structure the property can support.
That approach turns a collection of ratios into an actual underwriting process.
For educational purposes only. Real estate investing involves risk, and tax, financing, appraisal, landlord-tenant, and other legal requirements can vary by state, local jurisdiction, property type, loan program, and individual circumstances. Consult qualified legal, tax, lending, and real estate professionals for advice specific to your situation.
